Disclosure: I do not own AST Space Mobile (NASDAQ: ASTS), but after this piece I’ve become more cautiously optimistic about its prospects as satellites are stacking up in orbit and regulatory hurdles are being cleared. 2027 will be a very telling year with their launch schedule. I’m not a buyer at these price levels but prints in the $30’s would get me interested. Full disclaimer at the end.
1. The Setup
ASTS is a Wimbledon qualifier, unseeded but has won a round and looking to go deep into the draw. ASTS spent the spring and summer doing well in challenger events: it lost a satellite in April, collected most of the insurance payout on it, launched three replacements in June, and launched three more just five days before this post — putting more than a dozen BlueBirds in orbit with BB14 through BB46 already moving through production behind them. It also cleared a regulatory hurdle in April that triggers a real cash payment from one of its biggest partners. None of that showed up as revenue big enough to satisfy the crowd, and when yesterday’s quarterly earnings flashed a quarter that missed the number shares dropped — the fifth such miss in a row, by one tracker’s count. Meanwhile two other seeded players haven’t slowed down: Starlink keeps adding satellites and spectrum of its own, and Amazon’s Globalstar deal is still working its way through the sanctioning body. ASTS is a talented player with potential to reach the round of 64, but the question is can it reach center — the open question is still whether it can continue to execute – raise capital and deploy satellites – in order to reach Center Court.
2. What ASTS Does
ASTS is building a satellite constellation (“BlueBird,” or “BB,” satellites) designed to connect directly to ordinary, unmodified smartphones — no special hardware, no dish, no app — using the same cellular spectrum that mobile network operators (MNOs) already use on the ground. Instead of selling phone plans itself, ASTS’s business model is wholesale: it partners with MNOs (AT&T and Verizon in the U.S., Vodafone in Europe via a jointly owned venture called SatCo, Saudi Telecom Company in the Middle East, and over 60 MNO relationships globally covering more than 3 billion subscribers) and those carriers resell “SpaceMobile Service” to their own customers as an extension of normal coverage, filling dead zones where terrestrial towers don’t reach. The company has not yet launched that commercial service, though it cleared a real step toward it in April 2026 (see §3). Revenue today still comes from two other sources: selling gateway ground-station equipment and software to MNOs building out infrastructure ahead of launch, and completing paid technical milestones for the U.S. government (directly or through prime contractors) using its early satellites.
3. The Numbers, As Reported
All figures from the Company’s SEC filings unless a web source is explicitly cited. Dollars in millions except per-share and share-count figures. QoQ and YoY use unrounded underlying figures; changes ≥100% in magnitude are shown as “n/m” with the actual figure in parentheses, following the same “≥100% or not meaningful” convention AST itself uses in its own MD&A tables (Q2 2026 10-Q) — this is most of the P&L and balance sheet lines here, since Q2 2025 was still a near-zero-revenue quarter.
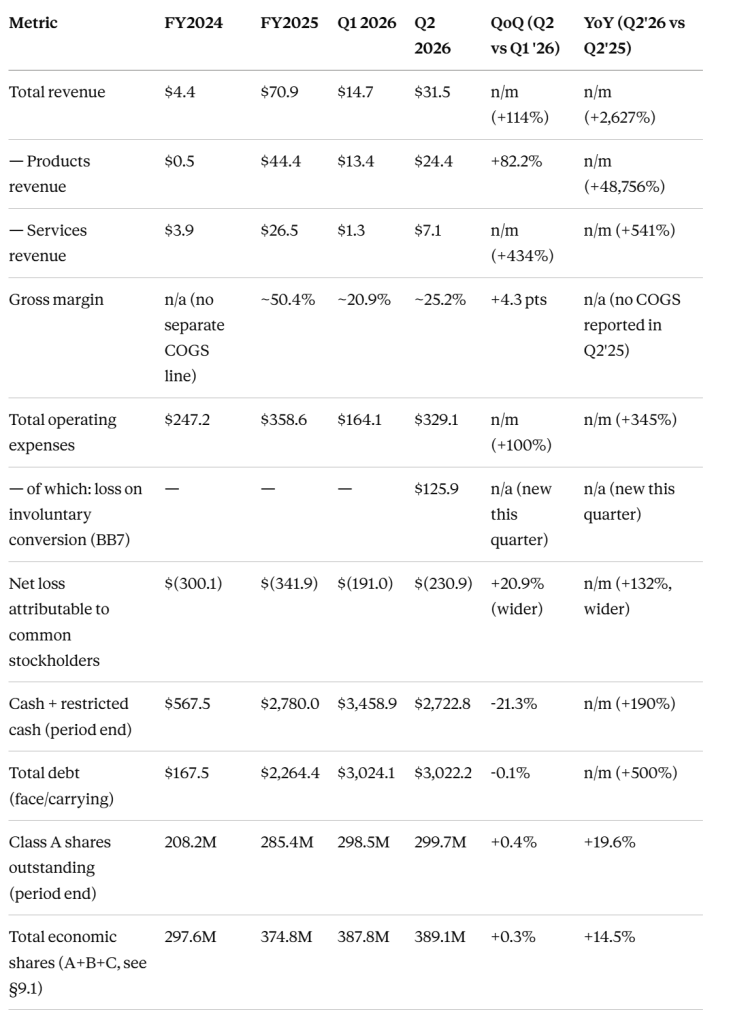
The last two rows are the most useful read on the QoQ/YoY columns: share-count growth (dilution) is running at a slow, single-digit-to-teens pace even as every dollar-denominated line above it moved by triple digits or more — a useful reminder that this quarter’s revenue and expense swings are a stage-of-company effect (ramping off a near-zero base), not primarily a dilution effect. Products revenue’s YoY figure (+48,756%) is the starkest illustration of why AST’s own convention caps out at “n/m” rather than showing a specific number — the Q2 2025 base was just $50,000, so the percentage is technically correct but tells you nothing beyond “not comparable.”
What actually changed this quarter, in order of importance:
- Revenue more than doubled sequentially but missed the Street. Q2 2026 revenue of $31.5 million was up from $14.7 million in Q1 — a real, sequential ramp — but landed below the roughly $35 million analyst consensus, and GAAP EPS of $(0.77) missed the $(0.37) consensus (Investing.com, TipRanks; Aug. 10, 2026). Per one tracker, this is the fifth straight quarter AST has missed Street revenue and/or EPS expectations (24/7 Wall St, Aug. 10, 2026) — worth flagging as a pattern in forecasting/expectations, not just a one-quarter miss.
- The BB7 loss is no longer an estimate — it’s a booked, resolved number. Last quarter’s ~$155–160 million estimate is now a filed $125.9 million net loss on involuntary conversion, after $32.5 million of insurance recoveries ($21.6 million collected in cash, $10.9 million receivable) (Q2 2026 10-Q, Notes 3 & 4). This is the single largest driver of the operating-expense jump and the widened net loss this quarter — but it’s now a closed, quantified item rather than an open risk. The constellation kept growing. BB8, BB9, and BB10 launched June 17, 2026 (deployed in July); BB11, BB12, and BB13 launched August 5, 2026 — five days before this filing (Q2 2026 10-Q). Combined with the five Block 1 satellites and BB6, that’s 12 satellites currently in the fleet by our own count from the filing; media trackers put the figure at roughly 13 (TipRanks, Aug. 10, 2026), a small discrepancy we can’t fully reconcile from the filing alone (possibly a test satellite counted separately) and are flagging rather than silently picking one. The company reaffirmed its “~45 BB satellites by early 2027” target with no further slippage disclosed this quarter (Q2 2026 10-Q) — a genuine positive relative to last quarter’s delay.
- A real regulatory hurdle cleared. On April 22, 2026, the company received “certain regulatory approvals for our SpaceMobile Service” (Q2 2026 10-Q, Note 6) — satisfying one of the two conditions in AST’s 2024 Memorandum of Understanding with Verizon (the other being a definitive commercial agreement, signed October 2025). As of this filing, Verizon’s resulting $45.0 million prepaid-service-revenue payment is disclosed as due but not yet received — worth watching whether it’s collected before the next print.
- Cash burned faster than it was replaced this quarter — before the July capital raise is factored in. Cash and restricted cash fell from $3.46 billion (March 31) to $2.72 billion (June 30) as capex accelerated (roughly $600 million of investing outflow in Q2 alone) against a Q2 financing activity that was, unusually, a small net outflow. That gap has since been closed: the company’s $1.15 billion 2034 convertible notes (1.625% coupon) priced and closed on July 20, 2026 — after the quarter but disclosed in this same filing (Q2 2026 10-Q, Note 6) — bringing pro forma cash to “more than $3.7 billion,” per management’s characterization on the call (Investing.com transcript, Aug. 10, 2026).
Forward guidance: Management reaffirmed full-year 2026 revenue guidance of $150–200 million on today’s call. New this quarter: guided Q3 2026 adjusted operating expenses (ex-cost-of-revenues) of $105–115 million and Q3 capital spending of $350–425 million — both a step up from H1’s pace — and, more strikingly, management pointed to revenue “approaching $1 billion” for 2027, described as the company’s first full year of commercial service. (Investing.com, Yahoo Finance, Aug. 10, 2026). This 2027 figure is meaningfully softer than the formal FY26 guidance — it is call commentary reported by financial media, not a number carried in the 10-Q with the same rigor as the $150–200 million range, and it’s worth holding against the five-consecutive-miss pattern noted above.
4. Weaknesses / Risks (bear case, evidenced)
- Structural — the core product still doesn’t exist commercially, and the Street is losing patience with the pace. Every dollar of revenue to date remains equipment resale or government milestones, not SpaceMobile subscription economics. Missing consensus for a fifth straight quarter (24/7 Wall St) doesn’t change the long-term thesis, but it is evidence that the market’s ability to look past lumpy, hard-to-forecast revenue has limits — and tonight’s ~4–8% share-price decline on an otherwise operationally strong quarter (see §4) is a direct illustration of that.
- Structural — dilution keeps compounding, and stock-based compensation is now the bigger driver of it. Stock-based compensation ran $118.8 million in the first half of 2026, versus $18.4 million in the first half of 2025 — a roughly 6.5x increase, now running at an annualized pace well north of $200 million against a company still doing under $50 million a quarter in revenue (Q2 2026 10-Q cash flow statement). The note-repurchase “sweetener” mechanism flagged last quarter also continued: $180.5 million and $433.7 million of new shares were issued specifically to fund repurchases of the 2032 4.25% and 2032 2.375% convertible notes, respectively, during the first half (Q2 2026 10-Q) — though the resulting P&L charge was concentrated in Q1 rather than spread evenly, so Q2’s “Other expense, net” line ($2.9 million) looked much cleaner than Q1’s ($100.5 million) largely for mechanical, not fundamental, reasons.
- The dilution-versus-incentive tradeoff here is genuinely two-sided, worth stating plainly rather than treating SBC only as a cost. Standard incentive-alignment logic holds that equity compensation ties employees’ and executives’ financial outcomes to the stock’s performance — plausible here given 58% of H1 2026’s SBC was booked to Engineering services (Q2 2026 10-Q, Note 10), consistent with a company competing for scarce aerospace/RF engineering talent against far larger, better-capitalized rivals (SpaceX, Amazon) without matching their cash comp. But the filings complicate a simple “more SBC means better-aligned incentives” reading: the bulk of AST’s equity awards are service-based, vesting on a straight four-to-five-year schedule tied to continued employment rather than to specific performance or share-price outcomes — a retention tool more than a pay-for-performance one. Of the performance-based awards that do exist, one disclosed vesting trigger is that “the Company attains an incremental capital investment” (Q2 2026 10-Q, Note 10) — alongside unspecified “other specified performance conditions” — meaning at least part of the performance-linked pool vests on raising more capital, not on execution or share-price outcomes, which is a more equivocal alignment signal than it first appears. Either way, the magnitude point stands: whatever the incentive design accomplishes, the dilution cost to non-insider shareholders is the same size regardless of how well it works.
- Cyclical/event-driven — the BB7 loss, now fully realized. The $125.9 million net write-off (see §3) was the single largest contributor to this quarter’s wider operating loss. It is now a closed, insurable, one-time item rather than an open estimate — worth distinguishing clearly from the structural risks above, same as flagged last quarter.
- Related-party health at SatCo has deteriorated. As of June 30, 2026, the carrying value of AST’s equity-method investment in SatCo (the Vodafone joint venture) was written down to zero as accumulated losses fully absorbed it, with additional losses now being taken against the related receivable balance (Q2 2026 10-Q, Note 14). This doesn’t change the consolidated numbers much on its own, but it’s a concrete sign that SatCo itself is burning cash faster than it’s generating value — worth watching as a leading indicator for the European leg of the commercial ramp.
- Competitive — the giants haven’t slowed down. Starlink’s Direct to Cell service remains commercially live and expanding, and Amazon’s pending Globalstar acquisition is still working through regulatory approval, unchanged from last quarter’s assessment (see §7, §8). One data point worth holding onto for context, not comfort: a widely cited industry estimate put T-Mobile’s Starlink-routed direct-to-device traffic at roughly 0.0003% of aggregate network utilization during peak summer months (Moneycheck, citing analyst commentary, Aug. 10, 2026) — suggesting the giant’s head start in satellites hasn’t yet translated into meaningful end-user usage, at least by this one measure.
- Cash burn accelerated this quarter. Roughly $600 million of investing outflow and continued heavy operating losses drew the balance sheet down faster than financing replaced it in Q2 specifically — resolved for now by the July capital raise, but a reminder of how quickly the liquidity cushion can compress during a heavy launch-and-build quarter.
5. Strengths (bull case, evidenced)
- A regulatory gate cleared, with real money attached. The April 22, 2026 regulatory approval for the SpaceMobile Service is a filed fact, not a narrative claim, and it directly triggers a $45.0 million cash payment owed by Verizon under a standing MOU (Q2 2026 10-Q, Note 6) — a small but concrete sign of forward motion toward commercial launch.
- Deep, aligned distribution relationships, still growing. AT&T, Vodafone, Google, and American Tower remain both commercial counterparties and equity holders in AST LLC, and the partner roster has grown to over 60 MNO relationships covering more than 3 billion subscribers (Q2 2026 10-Q) — up from “nearly 60” a quarter ago.
- Real contracted backlog, and cash on it improved in quality. Revenue allocated to remaining performance obligations was approximately $1.2 billion as of June 30, 2026 (Q2 2026 10-Q) — management cited $1.3 billion on today’s call, likely reflecting bookings since quarter-end. Separately, the revenue mix underneath this quarter’s growth improved: related-party sales to SatCo (AST’s own Vodafone joint venture) fell to just 7.9% of product revenue in Q2, down sharply from more than half of product revenue in Q1 (see §6, §9.3) — meaning the sequential revenue ramp was driven overwhelmingly by real third-party demand this quarter, not intercompany sales.
- Liquidity runway restored after a heavy capex quarter. Cash fell to $2.72 billion at quarter-end, but the already-closed July 2026 convertible raise brings pro forma cash to more than $3.7 billion (see §3) — comfortably funding the still-heavy Q3 capex guide of $350–425 million.
- A technical differentiator that keeps proving itself in orbit, not just on a slide. The Block 2 BB satellites’ roughly 2,400-square-foot phased array — the largest ever deployed commercially in LEO — has now flown across seven launched units (BB6 and BB8–13, net of the BB7 loss), each designed for up to 10x the bandwidth of the Block 1 satellites (Q2 2026 10-Q). The company also disclosed it has “reached a steady production stage” of its ASIC chips (intended for its AST5000 chip in future Block 2 satellites), and separately disclosed that BB14 through BB46 are already “in various stages of production and integration,” with some satellites in final pre-shipment quality review (Q2 2026 10-Q) — a materially deeper production pipeline than “satellites launched” alone conveys.
- Services (government) revenue carries real margin. Q2 2026 services revenue of $7.1 million came in at roughly 84% gross margin, versus roughly 8% on products (equipment resale) revenue — the U.S. government/milestone leg of the business, while still small, is genuinely high-margin (Q2 2026 10-Q, calculated).
6. The Driver
The revenue story shifted meaningfully this quarter. In Q1, the business was almost entirely equipment sales, and more than half of that was AST selling gateway hardware to its own SatCo joint venture — a weak signal on end-market demand. In Q2, products revenue ($24.4 million) still made up roughly 78% of total revenue, but related-party SatCo sales fell to just 7.9% of that products line, down from over half the quarter before (Q2 2026 10-Q, Note 14). That means the bulk of this quarter’s sequential revenue growth came from real, third-party gateway deliveries to other MNOs and from services revenue ($7.1 million, up from $1.3 million in Q1) tied to U.S. government milestone completions. This is a genuinely cleaner revenue quarter than Q1 on a quality-of-earnings basis, even though the absolute dollar figure missed Street expectations (see §3, §5).
7. Who Else is in the Draw
Unchanged from last quarter: two-horse race, unsettled — with a third horse still entering from a very different stable. Nothing in this filing set materially changed the competitive classification laid out last quarter:
- SpaceX / Starlink — commercially live, with 650+ direct-to-cell satellites and its own exclusive spectrum. Still the furthest ahead on deployment, though the T-Mobile usage data point in §5 is worth holding onto as a counterweight to assuming deployment lead automatically equals demand capture.
- Amazon (via the pending Globalstar acquisition) — still not closed, still expected in 2027, no material update found in this filing cycle.
- AST SpaceMobile — the only pure wholesale-to-carrier player, now with a growing, flight-proven satellite fleet and a cleared regulatory gate, but still the smallest constellation and the tightest capital position of the three.
- Legacy MSS operators (Iridium, Globalstar pre-deal, Inmarsat, Thuraya, Skylo) — unchanged, still oriented toward lower-data-rate applications.
This structure still determines almost everything downstream, exactly as flagged last quarter: ASTS’s moat depends on carriers preferring a neutral, non-competing wholesale supplier over vertically integrated rivals that increasingly don’t need one.
8. Moat and Margin Durability
Moat sources:
- Partner and regulatory relationships — definitive multi-year agreements with AT&T, Verizon, Vodafone/SatCo, and STC; a growing MNO network (60+ partners, 3+ billion subscribers); equity alignment with several of its largest customers; and the April 2026 regulatory approval (§3, §4) — the first regulatory green light specifically tied to commercial SpaceMobile Service, not just satellite operation.
- Spectrum authorization, more precisely stated than last quarter’s version. FCC authorization covers two distinct things: the planned 248-satellite network operating on low-band IMT terrestrial frequencies (Q2 2026 10-Q) — this is the “talk to a phone” spectrum, and for it AST still depends on contractual access to its carrier partners’ own licensed spectrum, not spectrum it holds outright — and, separately, Q/V-band feeder links in the V band (Q2 2026 10-Q), which are authorized directly to AST for the satellite-to-ground gateway backhaul. Worth correcting from how this was framed last quarter: AST isn’t spectrum-less, it’s spectrum-dependent specifically on the phone-facing side, which is the side that matters for the carrier-neutrality argument below.
- The large phased array does three distinct things for the moat, not just one, and each is worth naming separately. (1) It’s the specific mechanism that makes reaching an unmodified handheld device possible at all — a standard phone’s antenna is built for a nearby tower, not a satellite hundreds of kilometers up, so the satellite has to close nearly the entire link-budget gap itself, and physical aperture size is the primary lever for the signal gain that requires (Q2 2026 10-Q). (2) It enables tighter beamforming — narrower, more sharply defined spot beams — which the filing says cuts interference between beams and raises the capacity a single satellite can carry (Q2 2026 10-Q), layered on top of the AST5000 chip’s targeted 40 MHz-per-beam and 10,000 MHz of processing bandwidth per satellite once introduced (§4). (3) It’s the reason AST’s constellation math looks completely different from Starlink’s: a satellite this complex is heavier, costlier, and slower to build than Starlink’s smaller, simpler ones, which is why AST is targeting a constellation in the dozens (25 for noncontinuous coverage, 45–60 for continuous coverage in key markets, ~90 for full global, per §3) rather than the thousands — fewer, more capable satellites doing more work each, instead of sheer numbers.
- The large phased array does three distinct things for the moat, not just one, and each is worth naming separately. (1) It’s the specific mechanism that makes reaching an unmodified handheld device possible at all — a standard phone’s antenna is built for a nearby tower, not a satellite hundreds of kilometers up, so the satellite has to close nearly the entire link-budget gap itself, and physical aperture size is the primary lever for the signal gain that requires (Q2 2026 10-Q). (2) It enables tighter beamforming — narrower, more sharply defined spot beams — which the filing says cuts interference between beams and raises the capacity a single satellite can carry (Q2 2026 10-Q), layered on top of the AST5000 chip’s targeted 40 MHz-per-beam and 10,000 MHz of processing bandwidth per satellite once introduced (§4). (3) It’s the reason AST’s constellation math looks completely different from Starlink’s: a satellite this complex is heavier, costlier, and slower to build than Starlink’s smaller, simpler ones, which is why AST is targeting a constellation in the dozens (25 for noncontinuous coverage, 45–60 for continuous coverage in key markets, ~90 for full global, per §3) rather than the thousands — fewer, more capable satellites doing more work each, instead of sheer numbers.
- A real, quantifiable IP position — approximately 3,900 patent and patent-pending claims worldwide across 38 patent families, of which roughly 2,100 have been officially granted, with terms extending out to 2039 and beyond (Q2 2026 10-Q). This hadn’t been sized in this post before; it’s a genuine, filed data point rather than a qualitative “they have patents” claim.
- A working network-continuity capability, not just a lab demo. AST states it has validated satellite-to-satellite handover — seamlessly passing an active cell connection from one satellite to the next without dropping service (Q2 2026 10-Q) — which is a basic requirement for the service to feel like ordinary cellular coverage rather than an intermittent satellite pass, and one more thing that’s been tested rather than only promised.
What would erode it: The core competitive risk is unchanged from last quarter, now sharpened by the spectrum distinction above: AST’s “neutral supplier” position depends on carriers continuing to see value in a non-competing partner for the phone-facing spectrum it doesn’t hold outright. Starlink started from the same dependent position — its original Direct to Cell service with T-Mobile runs on T-Mobile’s own licensed spectrum — but SpaceX’s acquisition of 65 MHz of exclusive nationwide mid-band spectrum from EchoStar, FCC-approved in May 2026 (§5, §7), gives it a path to operate with or without any single carrier’s cooperation going forward, a structural independence AST’s model doesn’t have and isn’t pursuing. AST’s counter is everything enumerated above under “moat sources” — technical differentiation and deep relationships rather than spectrum independence of its own. Whether carriers value that combination enough to keep choosing AST once Starlink can operate independently of them is the real question underneath this moat. The T-Mobile usage data point in §5 is a reason for cautious optimism rather than complacency: it suggests this erosion hasn’t yet shown up in real consumer behavior, but a single data point from one carrier over one season isn’t strong evidence either way.
Margin defensibility: Gross margin improved to roughly 25% in Q2 from roughly 21% in Q1, still well below FY2025’s blended ~50% (Q2 2026 10-Q, calculated) — and the improvement this quarter came specifically from a richer mix of higher-margin services (government) revenue relative to thin-margin products (equipment) revenue (§4, §6), not from any structural improvement in equipment economics. The real test of margin durability still won’t arrive until the company recognizes its first dollar of actual SpaceMobile Service revenue.
9. Reading the Fine Print – Forensic Read of Filings
9.1 Share structure & dilution
Structure: an Up-C with Class A as the sole economic, publicly traded class, and non-economic Class B/C shares paired with AST LLC Common Units held by noncontrolling interest (NCI) holders, including founder/CEO Abel Avellan’s Class C super-voting stake (FY2025 10-K; Q2 2026 10-Q).
As of June 30, 2026, total economic shares were 299,731,073 (Class A) + 11,215,111 (Class B) + 78,163,078 (Class C) = 389,109,262 — up only about 1.3 million shares (~0.3%) from March 31’s 387.8 million, a much smaller quarterly increase than in prior periods. NCI fell only slightly further, to 23.0% from 23.1% (Q2 2026 10-Q) — the pace of NCI dilution has visibly slowed this quarter compared to the steady multi-point declines seen in every prior quarter reviewed. The same caution as last quarter stands: several data providers compute market cap using the Class A float alone, understating the true economic share count by roughly 30%.
Convertible overhang: As of June 30, 2026, outstanding convertible principal across the four pre-existing tranches totaled $2,553.5 million (2032 4.25%: $3.5M, down from $50.0M at year-end; 2032 2.375%: $325.0M, down from $575.0M; 2036 2.00%: $1,150.0M, unchanged; 2036 2.25%: $1,075.0M, unchanged) (Q2 2026 10-Q, Note 6) — essentially unchanged in aggregate from March 31, as the 2032-tranche paydowns were offset by nothing new issued during the quarter itself. The already-closed 2034 1.625% Convertible Notes — $1,150.0 million principal, priced and closed July 20, 2026, net proceeds $1,131.2 million, with capped calls (strike ~$79.57, cap price ~$149.20) purchased for $111.4 million — are disclosed in this same filing as a completed, not merely subsequent, transaction (Q2 2026 10-Q, Note 6). Pro forma total convertible principal is now roughly $3.7 billion, and total debt (all tranches) is roughly $4.17 billion.
9.2 Quality of earnings
- The BB7 loss is now realized, not estimated — $125.9 million, net of $32.5 million of insurance recoveries (§3, §5). This is a real cash-and-accounting event this quarter, not a forward-looking accrual to be second-guessed.
- Stock-based compensation accelerated sharply — $118.8 million for H1 2026 versus $18.4 million for H1 2025, a roughly 6.5x increase (Q2 2026 10-Q cash flow statement). This is now a materially larger claim on future dilution than the induced-conversion mechanism, in dollar terms, and deserves at least equal billing with that mechanism going forward.
- The induced-conversion “sweetener” pattern continued but was front-loaded into Q1. New share issuances of $180.5 million and $433.7 million funded further repurchases of the 2032 4.25% and 2032 2.375% notes respectively during H1 2026 (Q2 2026 10-Q), consistent with the recurring mechanism flagged last quarter — but the P&L “Other expense, net” impact was concentrated in Q1 ($100.5 million) rather than Q2 ($2.9 million), so a reader looking only at Q2’s income statement would understate how much of this mechanism is still active on a run-rate basis. Look at the cash flow statement’s share-issuance-for-repurchase lines, not just the quarterly “Other expense” line, to track this pattern going forward.
- Warrant remeasurement was immaterial this quarter ($(1.2) million for H1 2026, per the Q1 figure carried forward — no material Q2 warrant activity identified), consistent with the FY2025 10-K’s declining trend as legacy warrants wind down.
- No new cash-flow reclassifications, disclosed material weaknesses, or internal-control remediation costs were identified in the sections reviewed this quarter — same open-item caveat as last quarter (a full ICFR review remains outside the scope of this pass).
9.3 Related-party transactions & customer concerns
On the revenue side, the news is good: related-party SatCo revenue fell to 7.9% of product revenue in Q2, down from over half in Q1 (§6, §9.3 last quarter) — a genuine improvement in revenue quality. On the investment side, the news is worse: the carrying value of ASTS’s equity-method investment in SatCo went to zero as of June 30, 2026, with additional losses now being absorbed against the related receivable balance (Q2 2026 10-Q, Note 14). Read together, these two facts tell a consistent story — SatCo is burning through the capital ASTS put into it faster than it’s generating revenue for ASTS, even as ASTS’s own direct (non-SatCo) sales to other MNOs are picking up the growth slack. Beyond SatCo, the same overlap between commercial counterparties and equity holders (AT&T, Vodafone, American Tower, Google) noted last quarter is unchanged. No formal, quantified customer-concentration note was located in the filings reviewed — still an open item.
9.4 Off-balance-sheet items & contingent liabilities
The Ligado spectrum transaction remains open and unresolved: as of June 30, 2026, the Company had recorded $239.2 million of advanced consideration toward the Spectrum Usage Rights Transaction (Penny Warrants, L-band annual payments, Crown Castle annual payments, and transaction costs), and the closing “is still subject to receipt of satisfactory regulatory approvals,” per the filing’s own language (Q2 2026 10-Q, Note 8) — no change in status from last quarter despite the additional capital committed. Item 1, Legal Proceedings, again discloses no matter management considers likely to be material (Q2 2026 10-Q) — no going-concern language, no confirmed litigation finding, consistent with prior quarters.
9.5 Auditor & accounting notes
No auditor change disclosed. Note this is carried forward from the FY2025 10-K (KPMG LLP) rather than independently confirmed by the Q2 2026 10-Q — quarterly reports are unaudited and don’t include an auditor’s report, so this filing itself is silent on the point; a change would more likely surface via an 8-K, which wasn’t reviewed as part of this pass.
9.7 Verdict of this section (facts only)
Still a filing with several minor-to-moderate noted items — not a clean filing, but no confirmed red flag rising to a capital-deployment-freeze tier. Two items shift in this update: the BB7 write-off moves from “estimate to monitor” to “resolved, no further action needed,” while the SatCo equity-method write-down to zero is a new item that deserves the same monitoring status the related-party revenue concentration got last quarter — it’s a sign of stress in a 50%-owned joint venture, not (yet) a consolidated-balance-sheet problem. Stock-based compensation’s rapid acceleration is the other item to add to the watch list going forward.
10. Valuation – Entry/Exit Framework
10.1 Snapshot
Price as of 8/10 was $69/share and a market cap of $27B with a share count of 389.1 MM.
10.2 Multiple Comparison
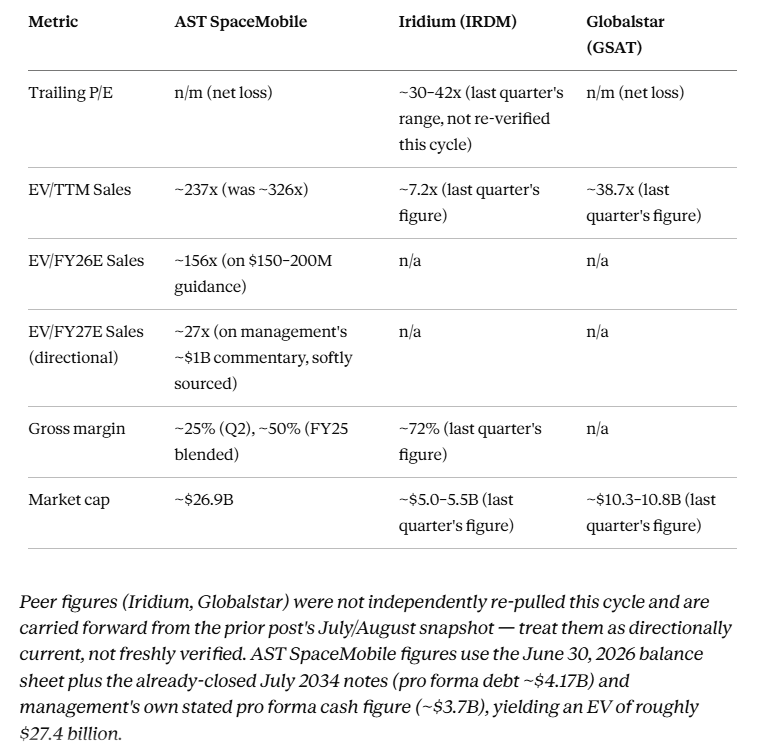
It’s difficult to put a single number on ASTS’ valuation and impossible to make any relevant comparisons to similar companies, hence the range of values here.
10.3 What’s priced in (reverse-engineered)
- On the FY26 numbers, the market is still pricing a multi-year bet with no clean historical base rate — unchanged from last quarter’s conclusion.
- On management’s FY27 commentary, taken at face value, the ~27x forward multiple would require roughly a 5–6x revenue increase from FY26’s guided range to the ~$1 billion figure in a single year, priced at a multiple that’s rich but not absurd relative to a high-growth infrastructure story — closer to “growth stock priced for strong execution” than “story stock priced for a miracle.”
- The gap between these two readings is the actual debate. Whether ASTS is closer to the first framing or the second depends entirely on whether the $1 billion figure should be trusted at the same level as the formal $150–200 million guidance — and the five-consecutive-quarter miss record argues for real skepticism there.
10.4 Scenario price targets (bull/base/bear)
Methodology: each price is built as EV = FY2027E revenue assumption × an EV/Sales multiple assumption, then Equity value = EV − pro forma net debt (~$472M, using pro forma debt of ~$4.17 billion from §9.1 less pro forma cash of ~$3.7 billion from §3), then Price = Equity value ÷ 389.1 million total economic shares (the last disclosed count, held constant across all three scenarios — a simplification that likely overstates every price below, since further dilution before FY2027 is probable, not just possible, given the capex pace in §3). As a sanity check, plugging in $1.0 billion of FY2027 revenue at the ~27.4x multiple implied by §10.2 reproduces today’s ~$69 price almost exactly — confirming the framework is internally consistent with where the stock actually trades.
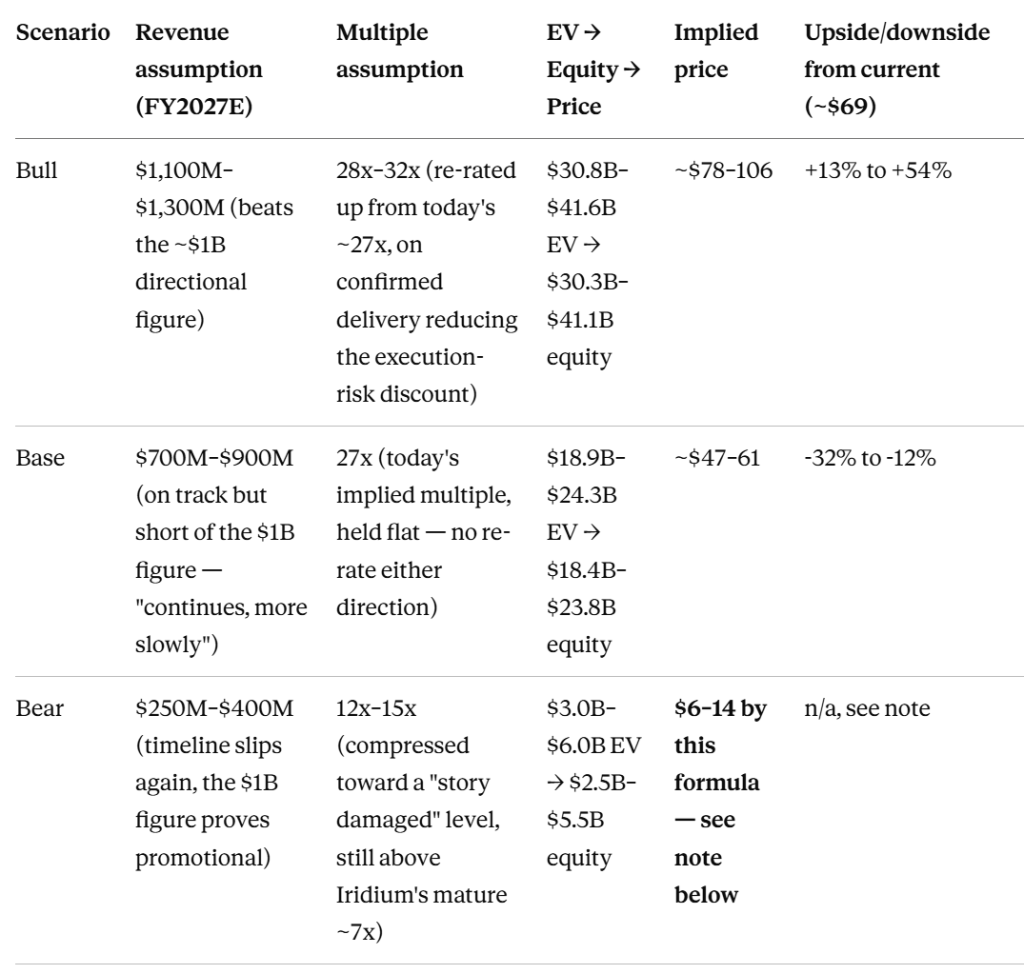
note: Bear case: the bottom-up formula ($6–14) is directionally right but not the number to use. That range sits below the stock’s actual 52-week low of $36.08 (§10.1) — meaning even ASTS’ worst trading days this cycle never priced it as cheaply as a “clean” revenue-multiple compression would suggest. That gap implies the market has been assigning some floor value beyond a pure forward-revenue multiple — plausibly the $1.2 billion backlog (§4), the technology/spectrum asset base, or takeout optionality given Amazon’s and SpaceX’s own recent moves in this space (§7) — none of which this simple formula captures. Given that, anchoring the bear case to the empirically observed low ($36–45) is more defensible than trusting the bottom-up multiple math to a level the stock has never actually traded at. The bull and base cases don’t have this problem, since they’re extrapolating from observed current pricing rather than well below it.
12. Reasons to be bullish or bearish
Bull case breaks if: The reset “~45 satellites by early 2027” timeline slips again, or a top-tier MNO partner is confirmed to be materially reducing reliance on AST SpaceMobile in favor of a competitor’s independent-spectrum service. New this quarter: also watch whether Verizon’s $45.0 million payment, disclosed as due, is actually collected before the next print — a small, near-term, checkable version of “is the partner relationship as solid as the filings suggest.”
Bear case breaks if: FY2026 revenue lands at or above the high end of the $150–200 million guidance range and the company shows real, checkable progress toward the ~$1 billion 2027 commentary (not just repeating the figure) and it funds the remaining buildout without a fourth dilutive raise in the next twelve months.
Next scheduled catalyst / date to watch: Q3 2026 results, expected around November 2026 (estimated based on AST’s historical reporting cadence, not yet confirmed) — the first look at whether the newly guided Q3 opex ($105–115 million) and capex ($350–425 million) ranges hold, and whether the Verizon payment and further satellite shipments — BB14 through BB46 are disclosed as already “in various stages of production and integration” (Q2 2026 10-Q) — convert into additional launches on schedule.
13. The Close
Think of the last earnings report as the scorecard from a qualifier’s first-round match at Wimbledon: ASTS won it, but the win alone doesn’t say anything about the next round. Three concrete things support the case that this qualifier can actually go deep into the draw.
- First, it survived a real injury without being forced to retire — the BB7 loss cost $125.9 million and a full quarter’s worth of constellation growth, and the financing held anyway, with six replacement satellites already back on court by the time this post went up.
- Second, it won a genuine point against the run of play: the April 22 regulatory approval is the first concrete step past the “promising rookie” stage, with real money attached to it — Verizon’s $45.0 million payment, disclosed as due.
- Third, the next few rounds are already being prepared for rather than started from scratch — BB14 through BB46 are already somewhere in production, a different posture than showing up to each match with nothing in reserve.
None of that showed up on the quarterly scoreboard, because the crowd was watching a different number, and a qualifier without a seed doesn’t get the benefit of the doubt a top-four player gets when a single set goes badly — hence the fifth-miss-in-a-row reaction despite a genuinely strong quarter underneath it.
The seeded players across the net haven’t lost a step either: Starlink is already several rounds into this tournament, and Amazon just arrived as a new, well-funded signing. Whether this qualifier is actually built for a deep run or is playing above its current ranking is still the entire question — the valuation gate says the market isn’t pricing it like a name in genuine distress even after tonight’s drop, and the operational gate says the buildout is progressing roughly on the reset schedule, but neither gate answers the question on its own, and tonight’s result doesn’t resolve it either way.
Personal note: cautiously optimistic this qualifier can go deep into the draw — the technology and the partner roster are real — but the string of consecutive misses raises a genuine, not cosmetic, concern about consistency and the ability to execute under pressure rather than only when conditions are favorable. Not bullish, not bearish, closer to watching from the stands — though a print in the $30s, within reach of the drawdown levels already discussed in §10, is a price where I’d be interested in placing a bet.
Disclaimer
This post is a personal research note, not investment, legal, or tax advice — nothing in it is a recommendation to buy, sell, or hold any security. It was drafted with the assistance of an AI model (Claude) working from AST SpaceMobile’s SEC filings and, where cited, from web searches of financial-media and analyst sources; both source types can contain errors, and AI-assisted drafting is not a substitute for independent verification or professional advice. Filing-sourced figures were checked against the underlying documents and known corrections are logged there rather than silently fixed — but this post has not been reviewed by a licensed financial analyst, attorney, or accountant, and no claim of completeness or freedom from error is made. Guidance, scenario price targets, analyst estimates, and any other forward-looking figures (§10 in particular) are inherently uncertain, may not reflect actual future results, and should be read as rough sanity checks rather than forecasts. First-person opinions in this post, including the personal note in §13, are the author’s own views at the time of writing, may change without notice, and are not professional recommendations. No current position in this security is disclosed as held; any mention of a hypothetical future purchase price is a personal reference point, not advice to act on. Past performance and current guidance do not guarantee future results. Do your own research and consult a licensed financial advisor before making investment decisions.


Leave a Reply