APP — AppLovin Corporation Bucket: Tactical Status: Equity position — small, speculative long, sized around the Q3 2026 earnings catalyst (~Nov 4, 2026) Date: September 8, 2026 · Financials current through: Q2 2026 · Source filings: FY2025 10-K, FY2024 10-K, Q1–Q3 2025 10-Qs, Q1 2026 10-Q, Q2 2026 10-Q
Two double-digit post-earnings drops in 2026 have cut AppLovin’s multiple roughly in half while the underlying growth rate barely moved — which raises the real question of this post: has the market already priced in almost every bad outcome except one specific, checkable scenario (a genuine double-digit collapse in installs that pricing power can’t out-run), and if so, is a small, defined-risk call option the right size of bet on that gap — not a share position in a business whose moat is thinner than its margins suggest.
1. The Setup
AppLovin’s last two years read a lot like Arsenal’s title run: years of being “the team that should be winning it,” followed by an actual breakthrough. Arsenal ended a 22-year league drought and won the 2025-26 Premier League, finally getting past Manchester City, the club that had blocked them for most of the decade. That’s the frame for AppLovin here — it just had its title-winning season, two years of genuinely dominant growth and margin numbers. The question now is the one every reigning champion faces: can you defend it against a club with City’s pedigree? Meta is this story’s Manchester City — not a club AppLovin can simply outspend (Arsenal and City’s own financial resources are actually much closer than people assume — their squads were valued identically for 2025-26), but a proven winner that, per §5, is playing some of its sharpest football in years right now. AppLovin’s entire attack has run through one player — its pricing power — while the rest of the team, installation volume, has gone quiet. AppLovin just won its first title. The real question is whether this is the start of a dynasty, or one great season before the bigger, more battle-tested rival takes the crown back. This post treats it as the latter — a season worth respecting, not yet a dynasty worth committing to for years.
2. What They Do
AppLovin runs an AI-powered advertising exchange: mobile app developers and, increasingly, e-commerce and other advertisers set a target return on ad spend, and AppLovin’s Axon AI recommendation engine finds and bids on the users most likely to hit that target, across a network of publisher apps. AppLovin doesn’t take possession of the ad inventory — it’s the matchmaker between advertiser demand and publisher supply — so revenue is booked net of what it pays publishers. The core product, Axon Ads Manager, “comprises the vast majority of revenue”; MAX (in-app bidding/monetization), Adjust (measurement/attribution SaaS), and Wurl (connected-TV ad tech) round out the platform. As of June 30, 2025, AppLovin sold its own mobile-games portfolio (the “Apps” business) to Tripledot — what’s left is a pure-play, single-segment advertising technology company. Worth noting up front, because it matters for the moat discussion in §8: per the Q2 2026 10-Q, “substantially all of the Company’s contracts with customers are cancelable at any time.” This is software sold on month-to-month terms into a market where the buyer’s own tooling is built to compare vendors continuously — a structurally different animal from a business protected by long contracts, switching costs, or physical scale.
3. The Numbers as Reported
Source: Q2 2026 10-Q, compared to prior-year periods as restated for discontinued operations. GAAP figures unless labeled non-GAAP.
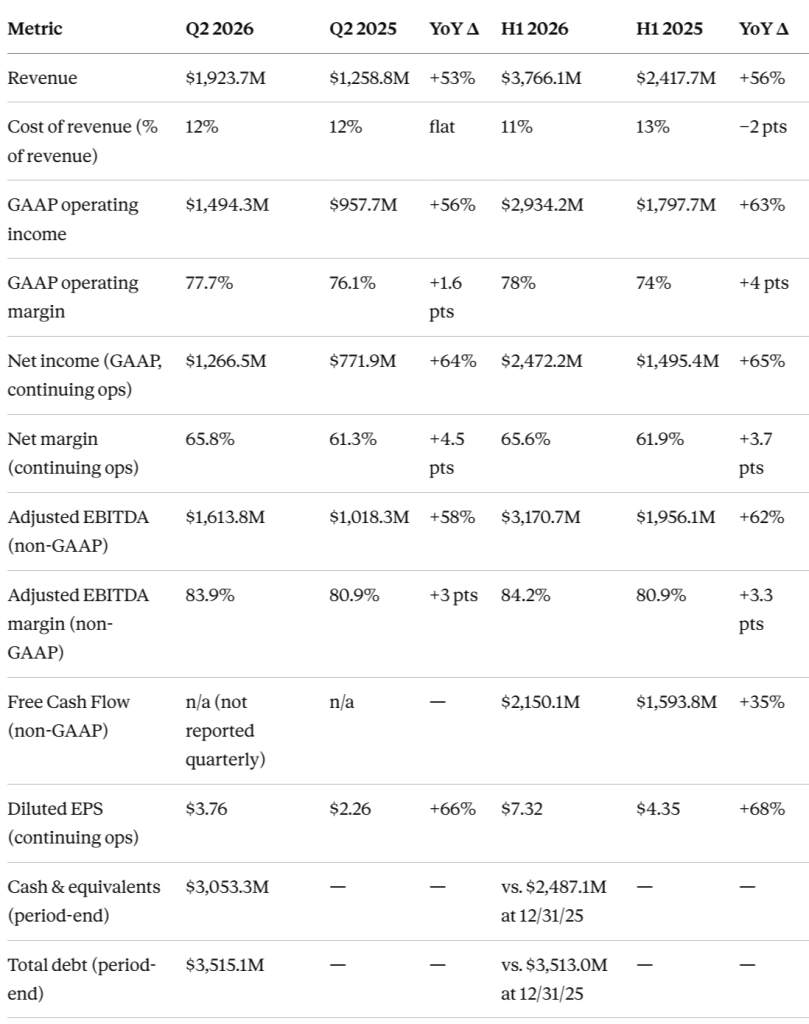
The number to watch every quarter from here: the split between net revenue per installation and installation volume. Growth has been carried almost entirely by pricing/yield, not reach, for five straight quarters:
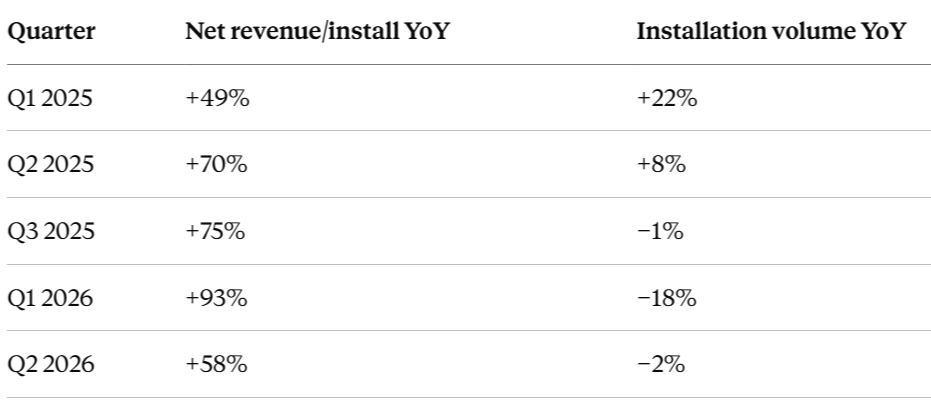
The working thesis threshold for this post (see §11.4) is built directly off this table, with one important refinement: Q1 2026 already printed a double-digit install decline (−18%) and the company still grew revenue 59% that quarter, because pricing/yield growth (+93%) more than absorbed it. So the bar isn’t simply “installs drop double-digit” — that already happened once without breaking the story. The more precise, evidence-consistent version of the risk is: a double-digit install decline that is not offset by comparably strong pricing/yield growth — i.e., both halves of the engine weakening at once, not just one.
Forward guidance (per earnings-release commentary and financial-media summaries of the August 5, 2026 report — not from the 10-Q itself): Q2 2026 landed slightly below consensus (revenue $1.92B vs. ~$1.94–1.95B expected), which management attributed to timing on an AI model deployment, already addressed post-quarter-end. Q3 2026 guidance: $2.055–2.085B revenue (+46–48% YoY), $1.71–1.74B Adjusted EBITDA. Shares fell 8–19% (sources vary) in the sessions that followed — the second double-digit post-earnings drop of 2026, after a ~22% decline in February.
4. Strengths (bull case, evidenced)
- Balance sheet is clean and getting cleaner. $3.05B cash against $3.52B in long-dated, fixed-rate debt (5.125%–5.950%, maturing 2029–2054, no near-term refinancing wall) — net debt of roughly $0.46B against a business generating over $4B of trailing free cash flow. This is a company that could retire its entire net debt position out of about six weeks of cash flow if it wanted to.
- Dilution is negative, not positive. Total shares outstanding fell from 338.3M to 335.3M over H1 2026 — buybacks ($1.5B in H1 2026 alone, on top of $2.2B in FY2025) are outrunning new issuance from equity compensation, not just offsetting it. Whatever else is true about this stock, shareholders are not being diluted away.
- Margins are genuinely elite. 84.2% Adjusted EBITDA margin and 78% GAAP operating margin (H1 2026) at a $6.8B TTM revenue base is a rare combination — very few companies growing >50% also convert that much of each incremental dollar to profit.
- Pricing power is the whole growth story, and it’s real. Net revenue per installation has grown 58–93% YoY every quarter for the last five quarters (table above) — direct, filed evidence that whatever AppLovin’s AI is doing, advertisers are willing to pay meaningfully more for it each quarter, not just get more volume at flat pricing.
- Low customer concentration. No single customer represented 10%+ of total revenue in 2023, 2024, or 2025, per the company’s own 10-K disclosure (the accounts-receivable concentration check is disclosed for 2024 and 2025 only) — the pricing power above isn’t being extracted from one or two whale accounts.
- The valuation has already absorbed a lot of bad news. Trailing P/E has compressed from an ~80–90x peak in 2025 to roughly 26.5x today (computed in §10.2), on a stock sitting only ~4% above its 52-week low after two separate double-digit post-earnings selloffs this year. A meaningful amount of disappointment appears to already be in the price — which is the core setup this post is arguing around, not a reason to assume the business itself has gotten better.
5. Weaknesses / Risks (bear case, evidenced)
- STRUCTURAL — this is a thin-moat software business, and the filings say so themselves. “Substantially all” customer contracts are cancelable at any time (Q2 2026 10-Q). The company’s own product, MAX, exists specifically to let publishers auction their inventory across multiple ad networks in real time — the industry’s own tooling is built for multi-homing, not lock-in. The FY2025 10-K names Meta, Google, Amazon, and Unity Software as direct competitors and states plainly: “the advertising ecosystem is intensely competitive.” None of AppLovin’s stated moat sources (data flywheel, auction speed, integrated stack) are protected by patents, exclusive contracts, regulatory barriers, or meaningful switching costs — they’re a current technology lead in a business where the buyer can and does compare vendors continuously. That’s a fundamentally different, more contestable position than a company with structural lock-in, regardless of how good the current numbers look.
- STRUCTURAL (second item) — the growth mix leans almost entirely on one lever. As shown in §3, installation volume has been flat-to-negative for four of the last five quarters, with all of the growth coming from price/yield. A pure-pricing growth model has a ceiling somewhere; it doesn’t resolve with “a good quarter,” it requires either volume to reaccelerate (new verticals) or yield gains to keep outrunning volume declines indefinitely — and the thin-moat point above means that yield edge is exactly the thing a fast-moving competitor could erode.
- CYCLICAL — the Q2 2026 guidance miss. Management’s own explanation (earnings-release commentary, not the 10-Q) was a resolvable timing issue on an AI model deployment. If accurate, this is a one-quarter event — but it was the second double-digit post-earnings drop of the year, and it triggered price-target cuts from Goldman Sachs, Wells Fargo, Piper Sandler, BTIG, and UBS.
- CATEGORY-CHANGING — securities litigation remains an open allegation, not a finding. The Brownback Action (class period Nov 7, 2024–Mar 27, 2025) alleges AppLovin and named officers made materially false and misleading statements about its advertising solutions and financial growth. A motion to dismiss was fully briefed as of February 2026; no accrual has been recorded because the company states it cannot reasonably estimate exposure.
- Flagged explicitly as unresolved, not confirmed.Emerging competitive signal that directly supports the thin-moat read. Unity Software’s AI-driven “Vector” ad engine, in the same mobile-gaming user-acquisition market, grew its Grow advertising segment 63% YoY in Q2 2026 — faster than AppLovin’s own 53% headline growth that quarter (per Unity’s own reporting, external to AppLovin’s filings). Unity’s ad-revenue base remains far smaller, so this isn’t a scale threat yet, but it’s precisely the kind of event the “no real moat” thesis predicts can happen — a comparable AI engine catching up quickly because there’s nothing structurally stopping it.
- Meta’s own AI investment is strengthening its ad product, not weakening it — and that cuts against a common bull-case assumption. It’s tempting to read Meta’s heavy 2026 AI capex spending and the investor pushback around it as a sign advertisers might be drifting from Meta toward alternatives like AppLovin. The evidence doesn’t support that: in Q2 2026 (reported July 29, 2026), Meta grew advertising revenue 27% YoY to $59.4 billion — its fastest ad growth since late 2021. (For context, in Q1 2026 Meta’s ad impressions had grown 19% YoY and price-per-ad 12% YoY, both its best rates in over a year — I wasn’t able to confirm the specific Q2 2026 split between those two sub-metrics, only the headline 27% revenue figure, so treat the Q1 numbers as directional color, not a Q2 data point.) Meta’s automated ad-buying suite, Advantage+, crossed a $75 billion annual revenue run-rate, and management attributed part of the gain to a new generative ad-ranking model delivering an 8.3% lift in ad clicks and a 15.7% lift in conversions (Source: Meta Q2 2026 earnings release and earnings call, July 29, 2026, as reported by Marketing Dive, Yahoo Finance, and Leverage Shares, Aug 2026). The pressure on Meta’s stock this year has been about capex (2026 guidance raised to $130–145B) and falling free cash flow, not about ad demand — that’s a margin/capex story for Meta shareholders, not evidence of ad-business attrition. If anything, this is a real risk to the thin-moat thesis in §7/§8: Meta is pouring its own AI investment into making its owned-and-operated inventory more effective, which is exactly the kind of walled-garden improvement that could pull advertiser budgets toward Meta over time rather than toward third-party networks like AppLovin. For scale, worth stating plainly rather than through the soccer analogy in §1: Meta’s Q2 2026 advertising revenue alone ($59.4B) was roughly 30x AppLovin’s entire quarterly revenue ($1.92B) — a real, large gap between the two companies, even though Arsenal and Manchester City’s own club finances are much closer than that. Platform dependency cuts both ways. Meta and Google are simultaneously AppLovin’s most important data/distribution partners and named competitors, per the 10-K.
- Founder-controlled governance. Foroughi and Chen control ~67% of voting power via 20-votes-per-share Class B stock, and AppLovin qualifies as a Nasdaq “controlled company.”
- Small related-party miss. A $50.0M investment in Humans, Inc. — tied to a then-board member’s dual role there — was fully impaired in 2025 on the investee’s own going-concern issues. Immaterial in dollar terms, worth remembering as a diligence flag.
- A real, if modest, dilution counterweight to the “little dilution” strength above. The October 2025 PSU grant ($410.5M grant-date fair value, vesting on market-cap milestones from $300B to $1T over 7 years) is future share-count pressure that the current net-buyback trend is currently outrunning — worth re-checking each time buyback pace is reported.
6. The Driver
The entire growth story runs through one mechanism: net revenue per installation on Axon Ads Manager (see §3 table). AppLovin discloses only a single reportable segment, so the exact vertical mix (gaming vs. e-commerce vs. CTV) is not available in the filings — an open item. Earnings-call commentary reported by Simply Wall St (external source) describes a “consumer vertical” hitting record spend, up 28% from Q4 2025 levels — directionally consistent with e-commerce contributing, but not independently verifiable from the 10-Q/10-K.
7. Who Else is on the Field
The FY2025 10-K names Meta, Google, Amazon, and Unity Software as competitors; more importantly, the structural facts support “multi-supplier rotation” specifically: contracts cancelable at any time, a company-built mediation product (MAX) whose entire purpose is enabling publishers to run multiple ad networks in parallel, and a live example (Unity’s Vector) of a rival AI engine re-accelerating quickly in the same core market. AppLovin is currently winning the rotation decisively — but “currently winning a rotation anyone can re-run” is a different, less durable position than “taking share in a fight with real barriers to entry,” and this post’s tactical framing follows from that distinction. Worth stressing: Meta — the Man City of this field, per §1 — is not standing still. It just posted 27% YoY ad revenue growth in Q2 2026, its fastest since late 2021, partly on AI-driven improvements to its own ad-ranking model (see §5 for figures and sourcing).
8. Moat + Margin Durability
– Moat sources (as the company would describe them): a data flywheel (more advertiser spend → more training signal → better yield predictions → more spend), auction infrastructure at “microsecond-level speeds,” and an integrated stack (Axon Ads Manager + MAX + Adjust + Wurl).
Why this isn’t a large moat, in practice: every one of those sources is a technology and scale advantage, not a structural barrier. There’s no patent estate, exclusive distribution agreement, regulatory license, or switching cost analogous to what protects moated businesses elsewhere in a portfolio. Customers can and do run parallel campaigns across networks; AppLovin’s own MAX product exists to facilitate exactly that comparison shopping. The Unity Vector data point in §5 is the concrete illustration: a rival AI-yield engine can and did close distance quickly, because nothing in the business model prevents it. This is the core of the “pure software, highly competitive space” read the header calls out — a real, current advantage, not a durable one by default.
Margin defensibility — is it the moat, or something more fragile? The H1 2026 Adjusted EBITDA margin expansion (80.9% → 84.2%) breaks down as: cost of revenue falling from 13% to 11% of revenue (genuine operating leverage on infrastructure spend), G&A falling from 4% to 2% (partly one-time items rolling off post-Apps-divestiture), while R&D actually rose from 4% to 5% of revenue on higher stock-based comp. Net effect is positive, but it’s a mix of real leverage, non-repeating cost items, and rising equity comp — not a pure “the technology is unassailable” story. Combined with the thin-moat read above, the honest framing is: the margins are excellent today; the thing protecting them long-term is a currently-winning technology position in a market with low switching costs, not a structural barrier — worth re-testing every quarter, not assumed as a permanent floor.
9. Reading the Fine Print — Forensic Read of the Filing
9.1 Share structure & dilution. Not an Up-C; Class A and Class B shares are economically identical, differing only in voting power (A: 1 vote, B: 20 votes, C: authorized but unissued, 0 votes). Total shares fell from 338.3M to 335.3M over H1 2026 — buybacks outpacing new issuance. No convertible debt, warrants, or other share-settled overhangs; the $3.52B in debt is straight fixed-rate senior notes.
9.2 Quality of earnings. Q2 2026 “other income, net” of $62.4M includes a $31.3M non-cash fair-value gain on non-marketable equity securities plus rising interest income — roughly half the swing is non-operating and worth backing out when modeling run-rate earnings. Core GAAP operating income is clean and grew 56% YoY with no unusual items embedded. Diluted EPS doesn’t diverge from headline net income (no Up-C/NCI structure).
9.3 Related-party transactions & customer concentration. The Humans, Inc. investment (§5) — a $50.0M related-party investment fully impaired in 2025 — is the one item worth flagging. Tripledot (equity-method related party post-divestiture) generated $18.0M/$42.9M of ad revenue in Q2/H1 2026, small and disclosed. No customer represented 10%+ of total revenue in 2023–2025; the accounts-receivable concentration check is disclosed only for 2024–2025.
9.4 Off-balance-sheet items & contingent liabilities. The Brownback Action securities litigation (§5) — labeled explicitly as allegation, not confirmed finding — with no accrual recorded. A $1.3B non-cancelable cloud-computing purchase commitment through 2027 ($953.5M paid as of June 30, 2026) is a real AI-infrastructure spending floor. No going-concern language applies to AppLovin itself.
9.5 Segment & geographic disclosure. Single reportable segment. Geography is genuinely diversified — U.S. $989.6M vs. rest-of-world $934.1M in Q2 2026, roughly 51/49. No supply-chain sourcing allegations identified.
9.6 Auditor & accounting notes. Deloitte & Touche LLP, auditor since 2015, no changes. One Critical Audit Matter for FY2025 (the October 2025 PSU valuation, requiring an independently rebuilt Monte Carlo model) — a disclosure of complexity, not a red flag by itself.
9.7 Verdict of this section. Filing with minor noted items.
10. Valuation — Entry/Exit Framework
10.1 Snapshot
Price ~ $320 . Shares: 335.3M basic / ~337.0M diluted. Market cap ≈ $116.3–116.9B; net debt ≈ $0.46B; enterprise value ≈ $116.8B. 52-week range $332.19–$745.61 — current price ~4% above the low, ~53% below the high. YTD roughly +7%, masking a violent round trip. This has not round-tripped — it’s sitting near its 52-week low following a real, recent decline, not a dip that already reversed.
10.2 Multiple panel
Trailing P/E ~26.5x (computed: TTM diluted net income from continuing ops ≈$4.41B ÷ ~337M shares ≈ $13.09 EPS; $346.80 ÷ $13.09). Forward P/E ~19–23x recomputed off the current price (third-party quotes of 22.85–26.10x predate the Aug 5–10 decline). EV/Sales (TTM) ~17.1x; EV/EBITDA (TTM, Adjusted) ~20.4x; P/FCF (TTM) ~25.8x. Peer set: Meta (not a true comp — diversified, owned-and-operated; trailing P/E ~21x, forward P/E ~17x, EV/EBITDA ~13x. Unity Software (closest structural comp, GAAP-lossmaking so P/E isn’t comparable, but its Grow segment growth of 63% YoY is the most relevant single data point in this table).
10.3 What’s priced in
At ~26.5x trailing / ~19–23x forward earnings, the market is pricing continued high-30s%-to-40s% growth with margins near current levels — a materially lower bar than the ~80–90x trailing multiple AppLovin carried at its 2025 peak. Analyst targets remain widely dispersed — Investing.com’s aggregation showed a $357 to $860 range across covering banks as of early August 2026, with individual actions like Citi’s cut to $650 and Goldman Sachs’s cut to $465 reported separately by CNBC/TipRanks — itself evidence the Street hasn’t converged on the “right” growth assumption post-guidance-miss. This is the crux of the thesis stated in the header: the multiple has already absorbed a lot of disappointment. The open question is whether it’s absorbed enough.
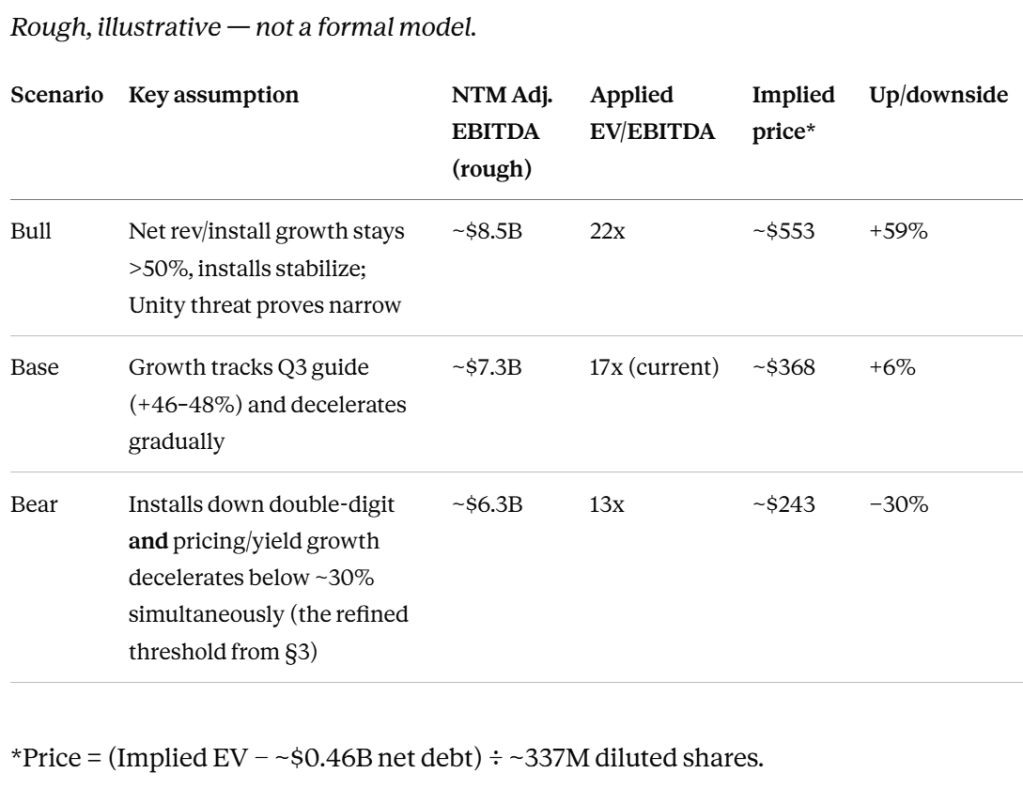
10.3 Scenario Price Targets (bull/base/bear)
10.5 Historical valuation context
Trailing P/E has ranged from ~80–90x at the 2025 peak down to ~26.5x today — bottom-decile of its own 2025–2026 history on a trailing basis. Genuinely cheap vs. its own history; not cheap in absolute terms (mid-20s trailing, ~20x EV/EBITDA are still premium multiples for any company).
10.6 Exit / trim framework — not applicable as written
Assume entering at ~ $320/share, I’m looking for at least >30% move around next earnings call in early November and will take profits at 30% and 50% gain and leave a little in case the stock rallies 100% to complete profit taking.
11. What Would Change the Read
11.1 Patterns at work
- Hype-cycle position: The narrative ran well ahead of the proof points at the 2025 peak; the market has since re-priced hard while the growth rate barely moved. The narrative may now be running level with, or slightly behind, the proof points — a meaningful swing.
- The giant showed up (partially) — Unity. Unity’s Vector-powered segment outgrew AppLovin’s core number for the first time in ~2 years. Given the thin-moat read in §7/§8, this is one of the two most important patterns to track — it’s a live test of whether “currently winning a rotation” holds up against a peer-scale challenger.
- The giant showed up (for real) — Meta, the Man City of this field. Unlike Unity, Meta isn’t a resurgent peer catching up — it’s the largest, best-capitalized player in digital advertising, and it just posted its fastest ad growth since 2021 (27% YoY to $59.4B in Q2 2026), partly on AI-driven gains to its own ad-ranking model (8.3% more clicks, 15.7% more conversions — Source: Meta Q2 2026 earnings, July 29, 2026; see §5 for full figures). Using the template’s own taxonomy: the shape here looks most like durable coexistence for now — Meta’s owned-and-operated inventory and AppLovin’s third-party publisher network aren’t perfect substitutes for every advertiser — but a superpower actively getting sharper in front of goal is a structurally different, and arguably larger, long-run risk to the thin-moat thesis than Unity’s smaller-scale resurgence.
- Financial-engineering/dilution pattern: No converts, no Up-C, no ATM program. Net dilution has actually been negative (§4), with the October 2025 PSU grant as the one real counterweight to watch.
- Founder-control/governance: Bimodal as always; capital-allocation evidence so far (net-reducing buybacks, the Apps divestiture) leans toward discipline.
- Regulatory/milestone dependency: The Brownback Action motion-to-dismiss ruling is a concrete, dated gate.
- Macro/rate-regime effects: The Q2 2026 selloff reads as name-specific rather than a sector-wide re-rating — The Trade Desk’s much larger 2026 collapse (52-week high ~$91 down to roughly $14 by Aug 10, per GuruFocus) reflects TTD’s own distinct issues. Meta’s stock also moved on its own news that same window (capex-guidance concerns after its July 29 report), but for a different reason (margin/capex anxiety, not ad-demand weakness per §5) — so the read here is “each name moved for its own reasons,” not “the whole sector re-rated together.” (See the macro discussion below this document for the broader set of factors that would make this sector-wide rather than idiosyncratic.)
- Story-stock base rate: Sustaining 40%+ growth for multiple more years off a $6–7B base is a high bar historically — the single largest thing the bull case has to keep re-proving.
11.3 So what
The precedents cut in different directions, and the thin-moat framing in this revision tilts the read slightly more cautious than the initial post: Unity and TTD both show a scaled AI-ad-yield story can decelerate or get contested faster than the market assumes, and AppLovin’s low-switching-cost structure (§7/§8) makes it more exposed to that pattern than Meta was in 2022. The near-term evidence (revenue still growing 53%+ even in the “miss” quarter) leans toward “not broken yet,” but the Unity trend is the data point most likely to flip that.
11.4 Bull/Bear cases
Bull case breaks if: Installation volume declines double-digit YoY and net revenue per installation growth decelerates below ~30% YoY in the same quarter — the refined version of the header’s thesis, reflecting that a double-digit install decline alone (Q1 2026: −18%) already happened without breaking the story, because pricing more than compensated. It’s both halves weakening together that would matter. Also breaks if Unity’s Grow/Vector segment sustains 50%+ growth for three or more additional quarters while AppLovin’s growth converges toward it.
Bear case (i.e., the “little room left for disappointment” thesis) breaks if: Q3 2026 results land at or above the guided range, and/or the pending motion to dismiss is granted — either would validate that the two 2026 selloffs were overreactions to resolvable issues rather than the start of a structural deceleration.
Next scheduled catalyst / date to watch: Q3 2026 earnings, ~November 4, 2026.
12. The Close
Back to the framing from §1: AppLovin just had its title-winning season, and nothing in this quarter’s numbers erases that. What this revision argues is narrower: after two double-digit selloffs cut the multiple roughly in half without the underlying results actually breaking, the stock may be pricing in most of the bad outcomes except one precise, checkable scenario — the one player carrying the whole attack (pricing power) going quiet at the same time the defense (installs) is already shaky. That risk is real against a proven rival like Meta, playing some of its best football in years right now per §5, which is exactly why the right-sized way to back this team into the next big match is a small, defined-risk options position — not a multi-year commitment to a club that’s only won the league once.
Disclaimer
This post is a personal research note, not investment, legal, or tax advice — nothing in it is a recommendation to buy, sell, or hold any security. It was drafted with the assistance of an AI model (Claude) working from AppLovin’s SEC filings and, where cited, from web searches of financial-media and analyst sources; both source types can contain errors, and AI-assisted drafting is not a substitute for independent verification or professional advice. Filing-sourced figures were checked against the underlying documents and known corrections are logged there rather than silently fixed — but this post has not been reviewed by a licensed financial analyst, attorney, or accountant, and no claim of completeness or freedom from error is made. Guidance, scenario price targets, analyst estimates, and any other forward-looking figures are inherently uncertain, may not reflect actual future results, and should be read as rough sanity checks rather than forecasts. First-person opinions in this post are the author’s own views at the time of writing, may change without notice, and are not professional recommendations. The author does hold shares of APP; any mention of a hypothetical future purchase price is a personal reference point, not advice to act on. Past performance and current guidance do not guarantee future results. Do your own research and consult a licensed financial advisor before making investment decisions.
 Quantum Yields
Leave a comment