Mode: A (held + prior deep dive) · Bucket: Speculative — “Oversold”. Sources: Q3 FY26 release (8-K Ex. 99.1, Nov 4, 2026), Q3 FY26 10-Q (signed Nov 4, 2026), transcript: third-party renderings (TradingKey, BigGo); official transcript pending, prior deep dive: AppLovin (APP): Can This Past Champion Defend Their Title? (Sept 8, 2026)
Disclosure: I own APP shares and plan to exit by end of January or sooner if my return targets are hit; I may trade at any time without notice. Drafted with AI assistance using my own investment framework; figures were checked against filings, but errors are possible
The Lens
AppLovin beat the top of its own Q3 revenue guide by ~$100M (+55% YoY) and guided Q4 above consensus. The scenario the deep dive feared — installs falling while pricing fades — went the other way: installs turned positive (+2%) and net revenue per install held at +55%.
Though APP exceeded expectations and raised guidance I was interested in APP only from a speculative short-term position as the stock was trading at historical lows and pricing in all the recent negative news. APP does not have a durable moat and their lunch is being eaten by their competition. I expect this stock will rally in the next three months (likely on the back of better than expected earnings and “rotation out of AI” stocks) but will be taking profits and completely exit this position before the end of January (Q1 ad-related earnings are historically soft and therefore investor expectations likely to be reset during that time).
1. The Quarter in One Table
Revenue and Adjusted EBITDA both landed ~$100M above the top of the company’s own guide; this is a clean beat, not a rounding beat.
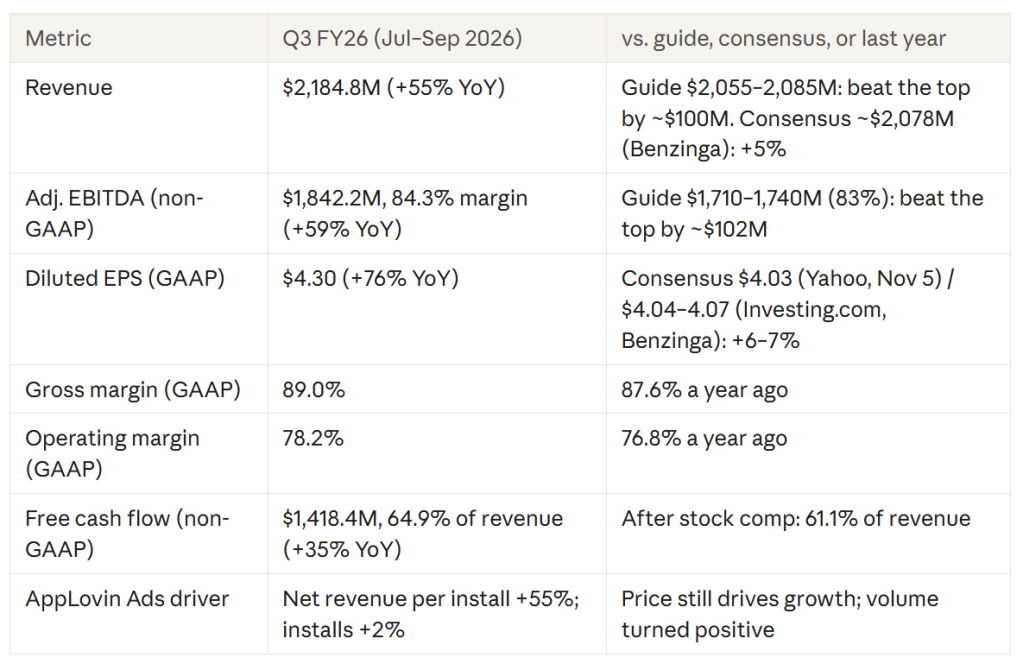
GAAP net income includes a $46.9M non-cash unrealized gain on private-equity fund stakes (NAV), inside $86.0M of “other income.” “Transaction-related expense and other” jumped to $15.5M from ~$0.06M in Q2, with no explanation in the 10-Q — open item. Consensus is third-party (Benzinga, Investing.com), not Yahoo; Gross margin = (revenue − cost of revenue) ÷ revenue, computed from the 10-Q.
2. Guidance: Then vs. Now
The Q4 guide midpoint of $2,380M sits 3–6% above pre-print consensus and implies +9% sequential and ~+43% YoY growth.
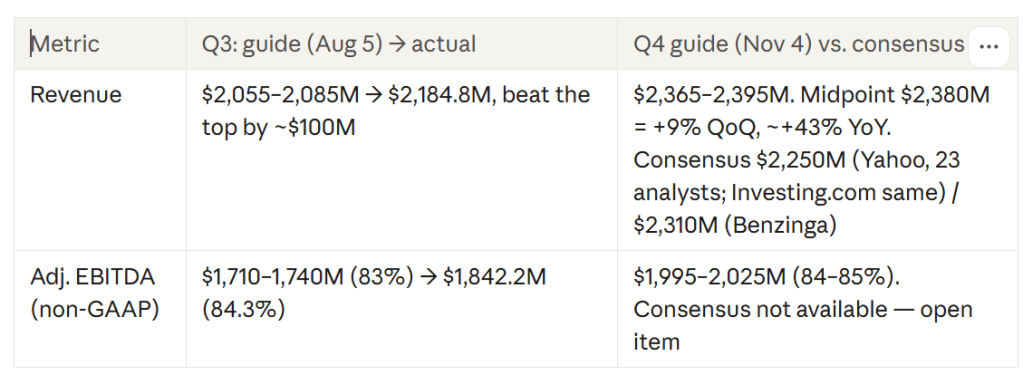
AppLovin gives no full-year guide; it guides one quarter at a time.
- Basis: Non-GAAP (Adjusted EBITDA) plus revenue; unchanged. No GAAP reconciliation for guidance, per the release.
- Stated reason: Q3 beat came “primarily” from core mobile gaming on model improvements, with continued scaling in the consumer vertical; gaming grew nearly 50% YoY; the new model generation was only partly rolled out, with no committed date for full rollout. The Q4 guide includes normal seasonality and model updates “already launched” — it does not explicitly exclude anything. Foroughi reportedly called Q2’s miss a self-inflicted “foot fault” (Benzinga headline, BigGo summary
- Seasonality flag (new): management said e-commerce spends heavily in Q4 and less in Q1, so bigger Q4s and tougher Q1s should be expected as that business grows.
- Guide quality (last 4 quarters): Q3 FY26 beat the high end
3. Critical Factors Scorecard
The deep dive’s bear-case break condition was met — Q3 landed above the guided range, which counts against the bear case, not against the position. The bull-case break trigger did not fire, but the Unity clock it named is now running.
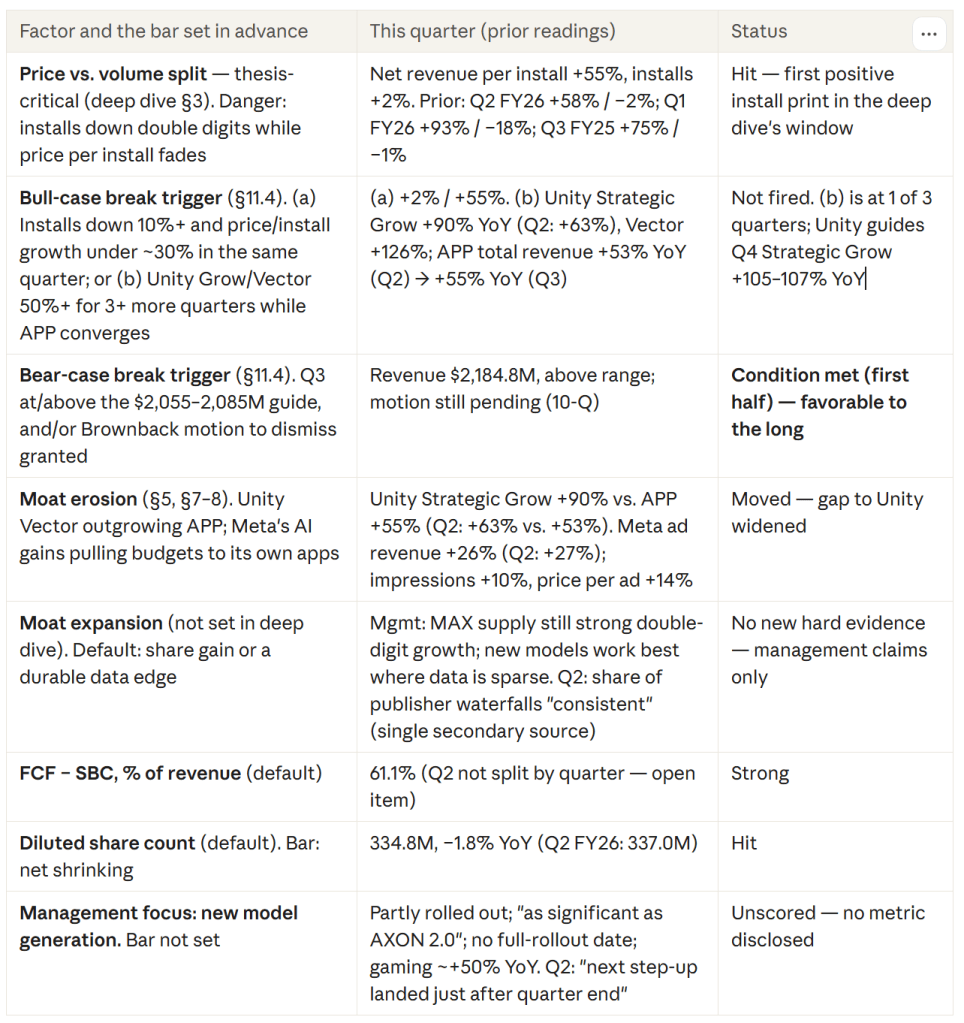
What moved, per the company: gaming re-accelerated on model gains, and consumer advertiser spend grew triple digits YoY and double digits QoQ. Installs (volume) are no longer shrinking. Price per install is still doing the heavy lifting, and its growth rate has stepped down from +93% to +55% over three quarters.
How to read “bear-case break.” The deep dive (§11.4) defined the bear case as the read that the two 2026 selloffs were the start of a structural slowdown, and said it breaks if Q3 lands at or above the $2,055–2,085M guide and/or the Brownback motion to dismiss is granted. Q3 came in at $2,184.8M, so the first half of that condition is met; the motion is still pending. One quarter weakens the bear case — it does not prove the bull case.
4. Balance Sheet and Quality Check
Net debt fell to ~$0.34B even after $1.38B of Q3 buybacks; nothing here changes the read.
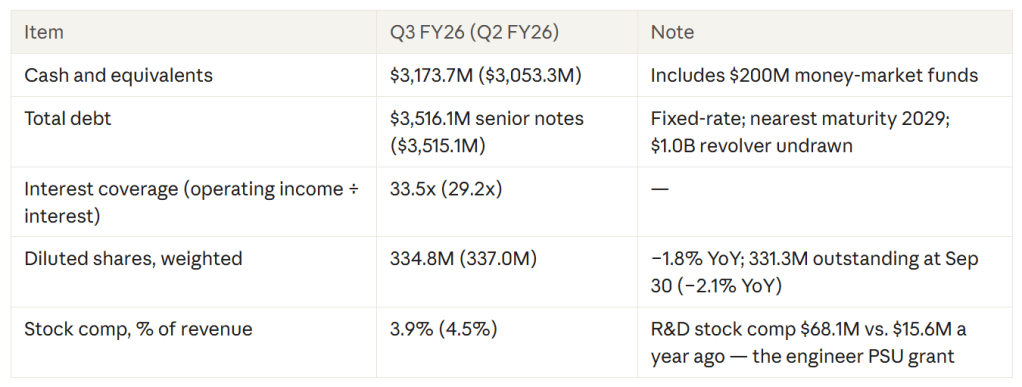
One-time / quality flags: $46.9M fair-value gain in other income (non-operating); $15.5M “transaction-related expense and other” added back in Adjusted EBITDA, cause not disclosed; effective tax rate 17.5% (vs. 18.2% LY). Cash paid for income taxes is $926M year-to-date vs. $167M a year ago — real cash leakage that Adjusted EBITDA hides. No restatement, auditor change, or material weakness in the 10-Q.
5. Between-Quarter Events (since Aug 5, 2026)
The biggest non-earnings event is governance: the controlling holders approved moving AppLovin’s incorporation from Delaware to Nevada by written consent, with no public-holder vote.
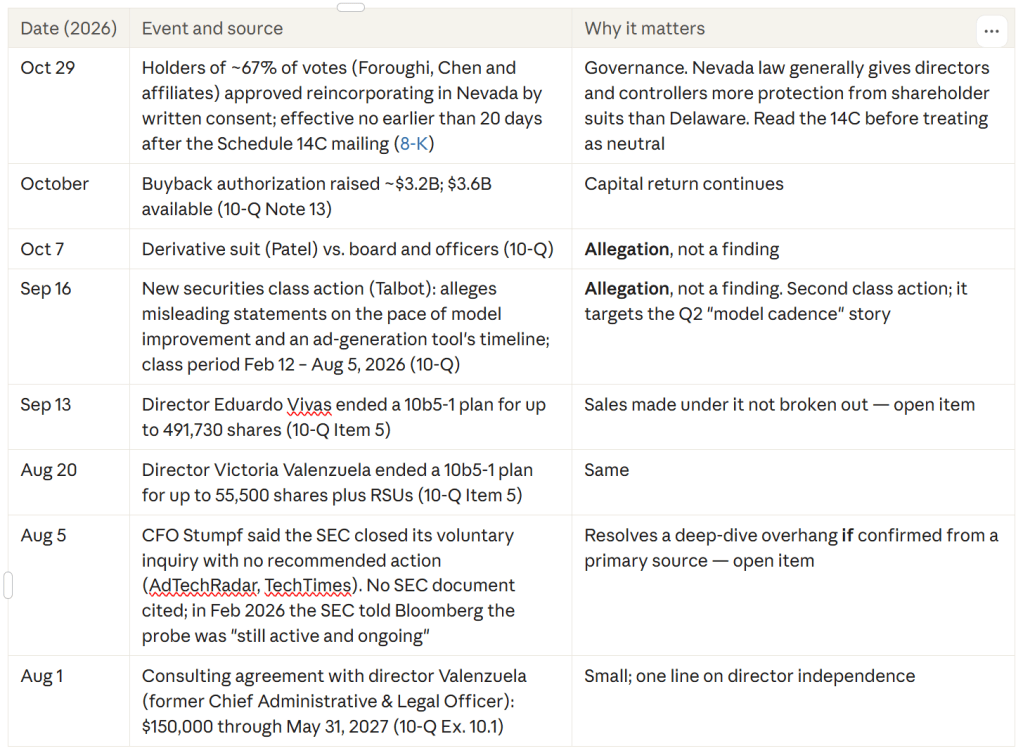
- Insider activity (Form 4): a third-party aggregator (Massive) shows $574.1M of open-market sales by 9 insiders in the 12 months to Oct 26, 2026, 52% under 10b5-1 plans, and zero purchases. A period-specific (Aug 5 – Nov 4) count from EDGAR is an open item.
- Litigation status: Brownback motion to dismiss still pending (fully briefed Feb 2026). No loss accrued; the company says it cannot estimate a range.
6. Market Reaction vs. Consensus
The stock jumped ~11% on Nov 4 before the print and traded ~17% higher pre-market after it — roughly back to the deep dive’s ~$320 reference price.
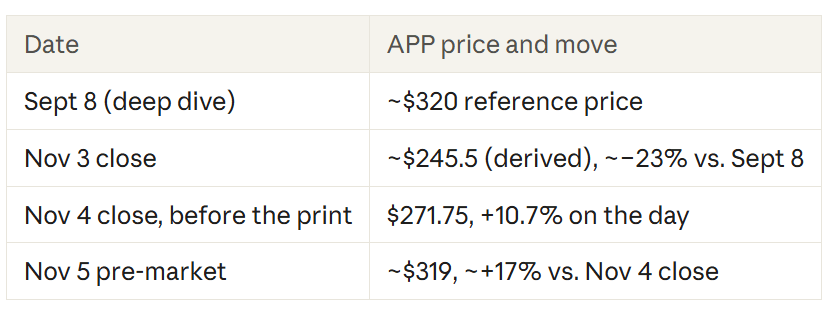
Why the market reacted (paraphrased):
- Revenue and EPS beat consensus by ~5–7%, and revenue cleared the top of guidance by ~$100M (Investing.com via Yahoo).
- The Q4 revenue guide topped consensus (Seeking Alpha News).
- Management framed the new model generation as only partly rolled out, implying more runway (Yahoo call recap).
What mattered most: the guide — it answered whether Q2’s miss was a one-quarter stumble. The stock had already priced some of that in with the +10.7% run on print day.
6.1 Do I agree with the reaction?
- What supports the market’s read: beat-and-raise on both revenue and Adjusted EBITDA (§1–2); installs no longer shrinking (§3); share count still falling; ~87% of incremental revenue flowed to Adjusted EBITDA quarter over quarter.
- What the market may be overweighting or missing: price-per-install growth has slowed three quarters running (+93% → +58% → +55%); Unity’s Vector-driven ad unit grew +90% YoY and guides above +100% (§3); a second securities suit targets the model-cadence story (§5); a Nevada move by written consent lowers shareholder protections (§5); the Q1 e-commerce seasonality warning sets up a softer Q1 sequential print.
7. Escalation Check
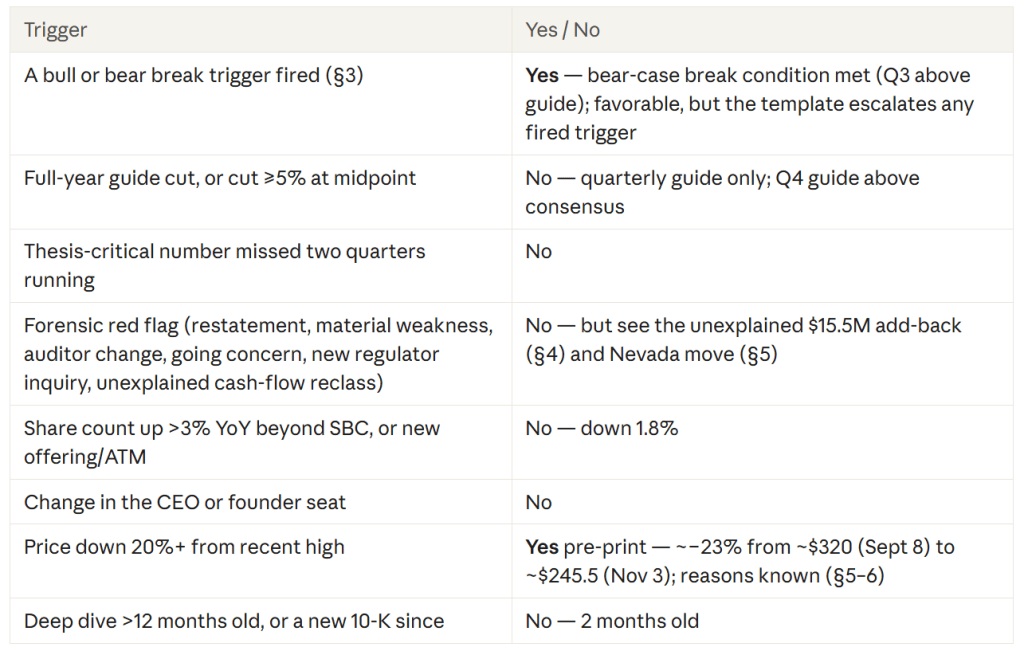
8. Valuation and Rule Check
Even after the pre-market jump, the price asks for ~18–20% revenue growth a year for five years at a 16x exit — about a third of what AppLovin is delivering now.
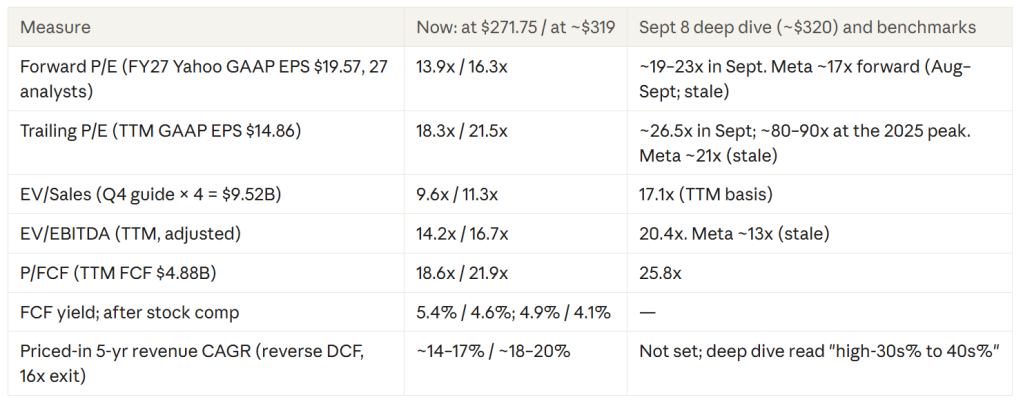
Market cap uses 334.8M diluted shares; net debt ~$0.34B. TTM = Q4 FY25 + 9M FY26. Yahoo’s FY26 revenue consensus ($8.07B, 31 analysts) implies Q4 of only ~$2.12B, below its own $2.25B Q4 average — the full-year figure looks stale and is not used.
Reverse DCF (Method A). Required year-5 revenue = market cap × (1 + cost of equity)^5 ÷ exit P/E ÷ net margin; then the CAGR from TTM revenue of $7.61B. Inputs: cost of equity 11.5%; net margin 60–66% (TTM GAAP is ~66%); exit P/E 16x, the top of the toolkit’s “None / Unproven” band (12–16x), since the deep dive called the moat thin but set no formal width. Buybacks ignored (slightly conservative).
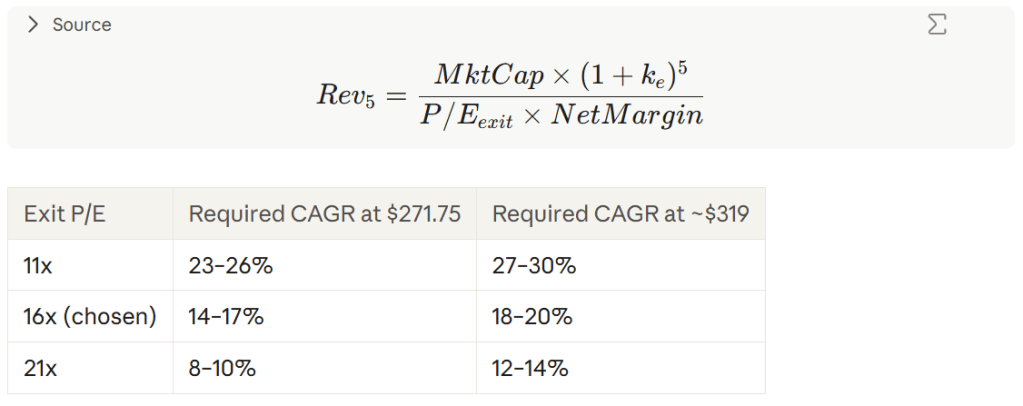
Delivered: +55% in Q3; Q4 guide implies ~+43%; management’s stated long-run goal is “roughly 30% annually”. The gap is wide at every exit multiple tested; the open question is durability, which this method does not answer.
Rule check:
- 15% pullback: Yes, pre-print (~−23% from Sept 8). Mostly undone by the pre-market move.
- 20%+ dislocation: Yes, pre-print. Know why? Yes — Q2 miss, second class action, sentiment into the print (§5–6).
- Valuation gate: Clears vs. own history (forward ~14–16x vs. ~19–23x in Sept and far above at the 2025 peak); roughly at the peer median (Meta ~17x, stale).
9. Decision Inputs
The business answered the deep dive’s question for now; the competitive question it raised got louder.
- Thesis status: strengthened on the numbers. The “little room for disappointment” thesis was validated: the bear-case break condition was met (Q3 above guide), and the feared combination — installs down 10%+ with price/install growth under ~30% — moved the other way (+2% / +55%).
- Moat durability: Prior verdict: thin, contested, “not durable by default.” This quarter’s evidence: stable for APP’s own numbers, contested on the field. Erosion observable moved — Unity Strategic Grow +90% (vs. APP +55%) and guided +105–107% for Q4; Meta price per ad +14%. A digest cannot widen the moat; the deep dive’s thin-moat verdict stands.
- Price vs. rules: 15% and 20% dip rules fired pre-print and were largely reversed pre-market; valuation gate clears vs. own history; the swing-trade rule vs. the deep dive’s +30%/+50% ladder is unresolved (§8).
- Priced in vs. delivered: ~14–20% required 5-yr revenue CAGR (16x exit) vs. +55% delivered and ~+43% guided.
Sources
- AppLovin Q3 FY26 release, 8-K Ex. 99.1 and 8-K cover (Nevada consent), Nov 4, 2026
- AppLovin 10-Qs for Q3 FY25, Q1 FY26, Q2 FY26, Q3 FY26 (provided files)
- AppLovin Q2 FY26 release (Q3 guide)
- Call summaries: Yahoo Finance, GuruFocus Q&A highlights, BigGo Finance
- Unity Q3 FY26 release, Nov 5, 2026
- Meta Q3 FY26 10-Q
- Consensus: Benzinga earnings page, Investing.com via Yahoo
- Insider totals: Massive (third-party aggregator)
Disclaimer: personal research note, not investment, legal, or tax advice. Drafted with AI assistance (Claude) from SEC filings and cited web sources, both of which can contain errors. Forward-looking figures are uncertain. The author holds APP. Do your own research.


Leave a Reply