Disclosure: I own shares of Bloom Energy (NYSE: BE), bought more last week and it is one of my high-conviction compounders. This is a quick follow-up to my Jul 16 thesis post (“The AI Infrastructure Play“) and the Jul 29 Q2 follow-up (“The Number I Was Watching“). Nothing here is financial advice. Full disclaimer at the end.
The Lens
BE surpassed expectations on revenue, margins, and earnings and even raised guidance again on this recent call. Negative free cash flow for the quarter is what punished the stock as BE is spending on building manufacturing capacity for their fuel cells. I added more on this recent weakness as the business is still intact, still growing, and though the moat is moderate and potentially growing, I believe the combination of grid delays and lack of competition gives BE a multi-year runway to develop manufacturing capacity which I expect will increase learning rates, bring costs down and ultimately result in a highly competitive energy generation technology in the long term. See my past posts on BE for more on the technology. Below is my updated analysis based recent financials.
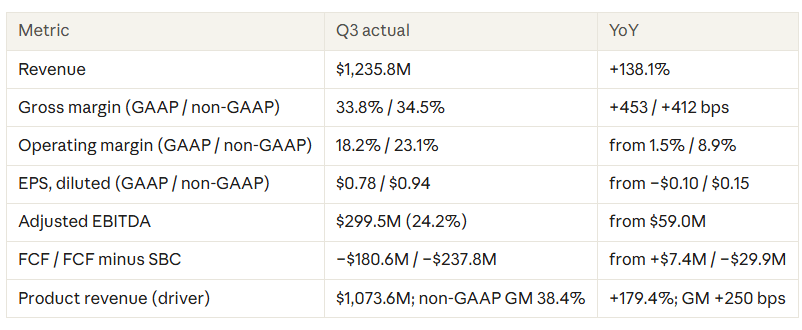
1. The Quarter in One Table
Q3 FY26 = July–September 2026. Bloom gives full-year guidance only, so “vs. guide” compares against the full-year bar.
Results
Against Expectations
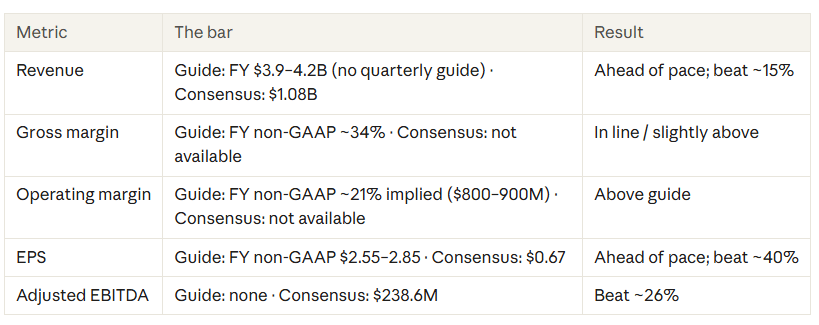
No guide or consensus was available for FCF or product revenue.
Consensus: Yahoo Finance (StockStory article, Oct 22, 2026); analyst count not shown. Other sources ranged $1.06–1.09B revenue and $0.67–0.69 EPS. FCF = operating cash flow (−$27.1M) minus capex ($153.5M); SBC = $57.2M from the cash flow statement. All company figures: Q3 8-K, Ex. 99.1. No one-time item drove GAAP this quarter; GAAP net income includes $22.1M of interest income and $12.6M of other income.
2. Guidance: Then vs. Now
Third raise of 2026. Revenue and profit went up; the gross-margin guide did not.
How the Full Year Guide Moved
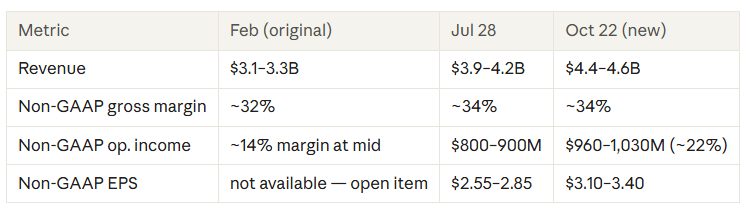
New guide vs. last quarter and the Street
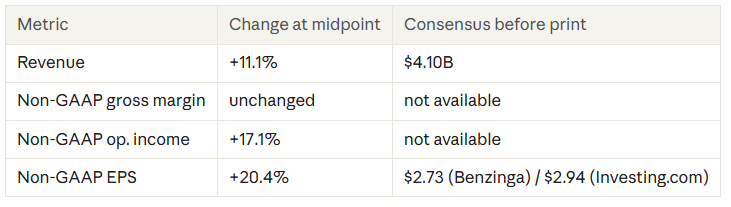
Next-quarter revenue is not guided; the new FY range implies Q4 revenue of $1.35–1.55B (consensus not available).
- Basis: non-GAAP throughout; no basis change. Implied Q4 = new FY range minus nine-month actuals ($3,052.3M revenue; ~$655M non-GAAP operating income using Q1’s $129.7M from the Jul 16 post). Implied Q4 non-GAAP operating income: $305–375M. Holding ~34% for the year implies Q4 gross margin of roughly 34–35%.
- Stated reason: the CFO tied the revenue raise to Q3 results and better visibility into Q4 delivery timing. Gross margin stays flat because new production lines are ramping and deliveries are being expedited, with cost-reduction programs still flowing into cost of goods.
- Guide quality: raised three times this year. Management says it entered 2026 expecting ~60% growth and now guides to ~122%. EPS beat consensus in 6 of the last 8 quarters (MarketBeat).
Sources: Q3 8-K; Q2 8-K; Q3 call transcript; FY consensus from Benzinga. Original revenue guide from the Jul 16 post; original margin figures from the CFO on the Q3 call.
3. Critical Factors Scorecard
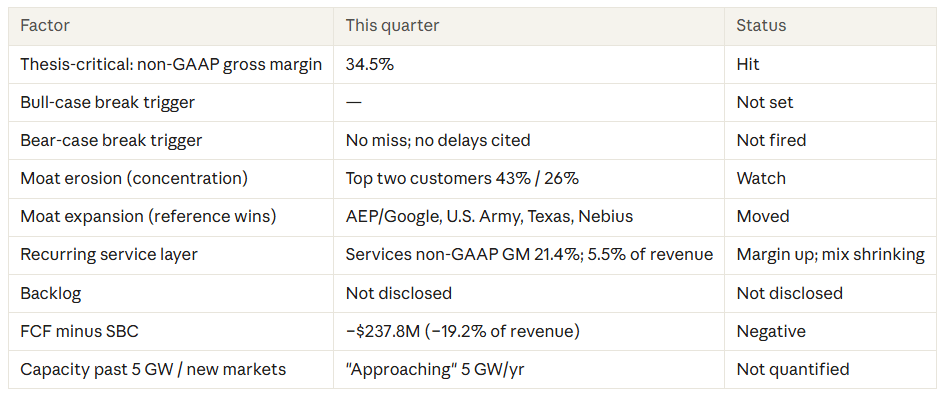
Detail by factor (source: this quarter · last 2–3 readings):
- Non-GAAP gross margin (deep dive, Jul 16). Bar: hold the ~34% guide as revenue ramps. Q3: 34.5%. Earlier: Q1 31.5% · Q2 34.3%.
- Bull-case break trigger (deep dive). Not set in the prior deep dive.
- Bear-case break trigger (deep dive). Bar: a margin miss tied to deployment delays. Q3: no miss and no delays cited. Not fired in Q2 either.
- Moat erosion (not set; proxy = the deep-dive risk “concentration”). Two customers were 43% and 26% of revenue (the 26% is a related party). The performance-guarantee cap rose to $846M at Q2 from $583M at Q1, and the Q2 10-Q cites fleet degradation. Earlier: Q3’25 one related party = 55% · Q1’26 50% / 12% · Q2’26 44% / 21%. Status: spreading slightly; guarantee cap up.
- Moat expansion In my view BE does not currently have a wide, deep moat but they are developing a moderate moat at present. The following are just AEP/Google 700 MW carbon-capture project; U.S. Army leases via partner Indelible; first Texas units; Nebius NJ first block ready. Earlier: Oracle, AEP, Brookfield. Company-reported.
- Recurring service layer (deep-dive moat source (c); type-specific). Services non-GAAP GM 21.4%; service revenue $67.6M (+15% YoY, flat QoQ) = 5.5% of revenue. Earlier GM: Q3’25 14.4% · Q2 22.0%. Share of revenue in Q3’25: 11.3%.
- Backlog (deep dive: ~$20B, as of Q1). Not disclosed; management says it is “growing faster than revenue” and promised a number with Q4. Disclosed product/install obligations: $394M Dec-25 → $441M Q1 → $442M Q2 → $661M Q3.
- FCF minus SBC (default factor). −$237.8M (−19.2% of revenue). Earlier: Q2 +$122.6M (+11.5%) · Q3’25 −$29.9M.
- Capacity past 5 GW and new markets (management focus, call). “Approaching” 5 GW/yr; Fremont footprint expanding; no timeline. Earlier: 1 → 2 GW by end-2026 (Q1).
Product margin carried the quarter: 38.4% non-GAAP, up 120 bps from Q2 despite ramp and expediting costs. Q2’s 37.2% included two one-time items that roughly cancelled: a $37.4M tariff refund and about $38.6M of new specific warranty reserve. With warranty falling in Q3, the 38.4% looks like the cleaner reading. Installation ran at a −3.5% non-GAAP margin, which the CFO called timing and mix. Management spent much of the call on capacity, carbon capture, 800 VDC and utility deals, and dwelt on backlog growth without giving a figure.
4. Balance Sheet and Quality Check
The balance sheet is roughly net-cash neutral and interest is easily covered. The quarter’s cash went into working capital and factory capex.
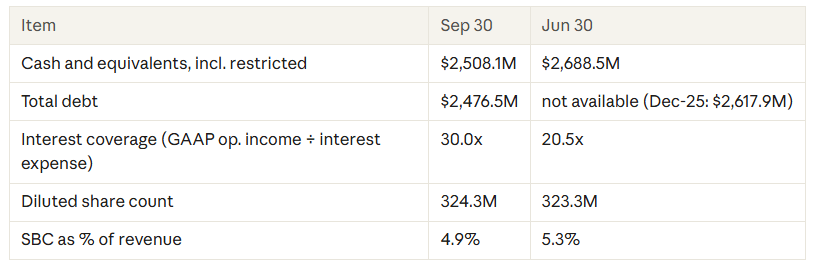
- Cash: −$180.4M in the quarter; YTD +$26.6M.
- Debt: recourse convertible “Green Notes” $2,473.5M + non-recourse $3.0M. Net cash ≈ +$10M. Almost all is the $2.5B 0% convertible due Nov 2030 (conversion price $194.97; its 19.6M shares are already in the diluted count). 2028 notes redeemed Jul 10; ~$27M of 2029 notes left. Nearest maturity: $2.6M Korean JV loan, Oct 2026. $600M revolver undrawn ($510M available).
- Interest coverage: interest expense $7.5M vs $8.9M; high mainly because the main convertible pays no coupon.
- Shares: diluted +3.8% YoY (vs 312.5M). Basic +25.5% YoY, mostly Green Note conversions (Q4 2025 and 2026), already in the diluted count, plus the Oracle warrant.
- SBC: $60.1M (non-GAAP add-back basis).
Flags:
- Working capital: contract assets (revenue booked, not yet billed) reached $858.6M vs $241.2M at Dec-25; receivables $634.7M vs $371.8M; inventory $927.7M vs $643.3M. Offset: customer deposits rose to $661.4M from $78.2M.
- Oracle warrant: a $306.5M “customer consideration asset” will reduce future revenue as Oracle systems ship. Only $17.3M has been recognized so far. Non-GAAP does not exclude it.
- Accrued warranty: $70.3M vs $20.0M at Dec-25. The Q1 and Q2 10-Qs show a specific warranty reserve for identified product issues: $19.7M at Q1, $58.3M at Q2, booked in product cost. The issues are not described. Hunterbrook’s fleet-efficiency claims remain allegations and the filings do not link the two. Separately, the performance-guarantee cap rose to $846M at Q2 from $583M at Q1.
- Capex: $153.5M in Q3 vs $51.6M in Q2, for production capacity in Fremont and Newark.
Sources: Q3 8-K balance sheet and cash flow; Q3 10-Q Notes 1 and 3.
5. Valuation (Today vs. 5-years forward)
The market’s assumption at $203/share: revenue grows about 64% a year for five years, to roughly $46B by 2031 — about 10x this year’s $4.5B guide.
Bloom has delivered +145% so far in 2026 and guides to about +122% for the full year, but that revenue growth is already in the starting number: the five-year clock runs from trailing revenue, which includes most of 2026. It shows momentum, not a head start. From the FY26 guide, the price needs about 79% revenue growth a year from 2027 through 2031. Holding analysts’ ~59% next-12-month revenue growth rate every year lands at about today’s price; a slow fade falls just short and a fast fade well short.
5.1 The Calculation (reverse DCF method)
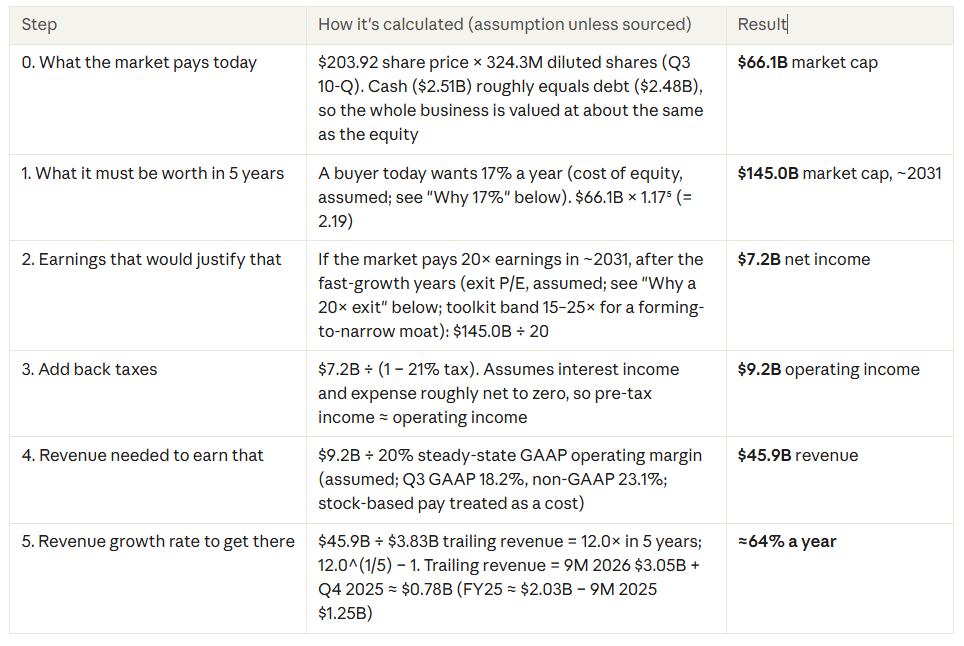
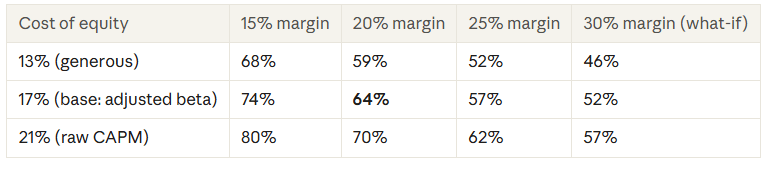
Why 17%: CAPM with today’s inputs — 10-year Treasury ~4.96% (Mortgage News Daily, Oct 25–26, 2026), BE beta 3.78 (Yahoo Finance, 5-yr monthly, Oct 26, 2026) and an equity risk premium of 4.23% (Damodaran, Jan 2026) — gives about 21%. That raw beta largely reflects Bloom’s history as a volatile small cap, so the base uses a commonly adjusted beta (⅔ × 3.78 + ⅓ ≈ 2.9), which gives about 17%. A May 2024 beta of ~2.1 (GuruFocus) would give about 14%. The choice is an assumption, not a sourced input.
Why a 20× exit, not a growth multiple: the exit P/E is what investors pay around 2031, after the five years of fast revenue growth already counted in steps 1–5. Using a high-growth multiple here would count that growth twice. I set exit bands by moat verdict: 15–20× for a forming moat, 18–25× narrow, 22–30× wide, and up to 35× only for a wide moat still growing 10%+ at year 5. If Bloom is still growing 10%+ in 2031 and earns a wide-moat premium, a 30× exit lowers the required revenue growth to about 51% a year and 35× to about 47% (17% cost of equity, 20% margin).
5.2 Sensitivities
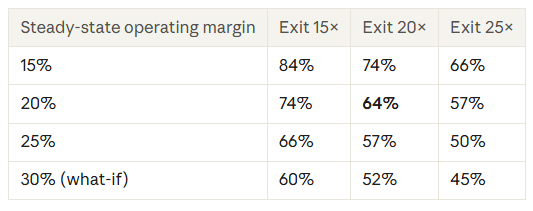
How margins are treated. The model doesn’t track margins year by year. It picks one steady-state GAAP operating margin and applies it to year-5 revenue (step 4 above); how the margin gets there along the way doesn’t change the answer. So margin expansion shows up only as a higher margin row below: each 5 points of margin cuts the required revenue growth by roughly 6–10 points. The base case’s 20% assumes modest expansion from Q3’s 18.2% GAAP margin and stays below the 23.1% non-GAAP margin, because stock-based pay is treated as a real cost. The 30% row is a what-if only.
Two simplifications to keep in mind. First, cash earned in years 1–5 isn’t credited, and the capex and working capital needed to grow this fast aren’t charged (Q3 free cash flow was −$180.6M); the model assumes the two roughly offset. Second, high margins usually arrive as revenue growth slows, which tends to bring a lower P/E, so the high-margin, 25×-exit corner is the most conservative case, not necessary the likeliest.
Margin x exit multiple (5-year revenue CAGR needed, 17% cost of equity):
Cost of equity × margin (5-year revenue CAGR needed, 20× exit):
5.3 Where the price could be in 5 years (scenarios)
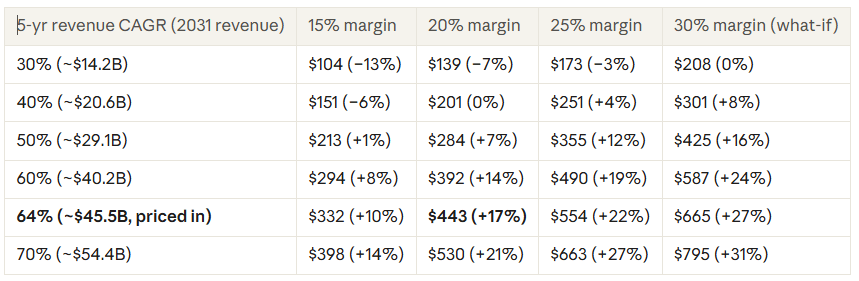
The same math run forward: pick a revenue growth rate and a margin, and read off the share price in ~2031. Each cell is 2031 revenue × operating margin × (1 − 21% tax) × 20× exit P/E ÷ 324.3M diluted shares. The figure in brackets is the yearly return from $203.92.
How to read this table:
- The priced-in cell checks out: 64% revenue growth at a 20% margin gives ~$443, a 17% yearly return, which is exactly the cost of equity the reverse DCF used.
- Break-even is about 40% revenue growth at a 20% margin: that leaves the stock roughly flat (~$201) after five years.
- Margin and exit multiple move the price the same way: both multiply earnings, so a 25× exit at a 20% margin gives the same price as a 25% margin at 20×. The 25% column doubles as the “25× exit” case, and the 30% column as “30×.”
Disclaimer: I own shares of BE. This post reflects my personal opinions and analysis for informational purposes only. It is not financial, investment, or tax advice, and it is not a recommendation to buy or sell any security. Figures are drawn from company filings and public reporting as of October 26, 2026, and may be out of date by the time you read this. Markets involve risk, including loss of principal. Do your own research and consult a licensed professional before investing.


Leave a Reply