Thesis
The new U.S. Administration shows promise of boosting the economy. As Trump has stated, he’s pro deregulation, AI infrastructure, energy infrastructure, and set on reducing business friction in the U.S. However, he also has vowed to place tariffs on foreign goods and deport illegal immigrants, which, if executed unthoughtfully, could actually result in an increase in prices or inflation and completely derail the economy. As of today, it’s not exactly clear how these factors will play into overall inflation and interest rates but let’s simplify the analysis for now and just assume he will be a rational businessman at the end of the day and he and his cabinet will ultimately act rationally in their policies and support economic growth.
This infrastructure growth is being fueled by advancements in AI and machine learning. If you’ve been paying attention, folks like Jensen Huang are calling these the early days of AI with many making comparisons to the early days of the internet. We have entered a new growth era and looking for ways to ride this wave with as little risk as possible.
This is what brings me to data centers. All the large tech companies (Google, Meta, Microsoft, Amazon, etc.) are spending billions on data centers and there is just not enough energy available to support the demand. This is one reason why alternative asset companies look attractive. They do invest in data center operations, directly and indirectly, but their portfolios are generally much larger and more diverse than that and that’s what we’ll discuss in this blog and see if we can identify an investment opportunity in KKR or other alternative asset investment companies.
Alternative Asset Players
This class of companies brings an interesting approach to infrastructure investments. They themselves are typically highly diverse as they invest in a range of diverse assets and asset classes such as private equity, real estate, infrastructure, credit, and hedge funds. What’s attractive about them is their long-term thinking which aligns well with my investment style. Not only are they seeking long-term, low risk investments, but they’re looking for ones that will also generate excess returns over their lifetimes.
The chart below highlights five alternative investment companies:
- Brookfield (BN)
- Carlyle Group (CG)
- KKR & Co. (KKR)
- BlackRock (BLK)
- Blackstone (BX).
All of them have done relatively well, beating the S&P 500, but one in particular stands out and that is KKR which returned 93% over the past year, significantly higher than the S&P’s ~23%.

This performance by KKR is eye-catching so let’s talk about what has changed in 2024 and why their stock has done so well and whether we can be sufficiently confident this will extend into future years.
KKR Overview
KKR, as an asset management firm, generates revenue from multiple methods. I won’t go into detail on all these but will talk about the ones that are the main drivers of revenues and growth. The five business lines consist of:
- Private equity (59% of total holdings)
- $176B in AUM
- Real assets (21% which includes real estate, infrastructure, and energy)
- $130B in AUM
- Credit and liquid strategies (12%)
- $245B in AUM
- Capital markets
- Principal activities
Private equity (PE) consists of core equity, traditional equity, and growth equity. Core equity represents assets that are lower risk and leverage but expected to continue to generate consistent returns over the long term. The IRR since inception of core equity is 19%. It’s difficult to know exactly what assets these (PE) funds are investing in but what’s key to know is KKR’s investing process which is described in their 10K and invest in a diverse set of assets. Some key points on their investment philosophy that give me confidence in their long-term investment decision making:
- “…focuses on achieving multiples of invested capital and attractive risk-adjusted IRRs..”
- “…applying rigorous standards of due diligence when making investment decisions, implementing strategic and operational changes that drive growth and value creation…”
- “We have access to significant opportunities for making private equity investments as a result of our sizable capital base, global platform, and relationships with leading executives…”
- “Private equity fund’s general partner is generally entitled to a carried interest that allocates to it 20% of net profits realized…”
- “…our private equity fund documents generally require the general partners of the funds to make minimum capital commitments to the funds.”
Their geographic focus is primarily the Americas at 70% with 15% allocated to Asia-Pacific and the remainder spread between Europe and the Middle East. I generally prefer this as America’s entrepreneurial spirit and general preference towards deregulation does not limit investment opportunities or stranglehold returns.
Lastly, in addition to these business lines, they own a majority stake in an insurance business operated by Global Atlantic which accounts for a large portion of the fees (or revenue) generated for KKR. Below is a summary of fees collected by KKR over the past several years.
| Line Items | 2024 | 2023 | 2022 |
| Total Management Fees | 3,461,381 | 3,030,325 | 2,656,487 |
| Private Equity | 1,376,335 | 1,286,062 | 1,188,463 |
| Real Assets | 992,731 | 825,735 | 679,890 |
| Credit and Liquid Strategies | 1,092,315 | 918,528 | 788,134 |
| Total Insurance Revenues | 14,666,452 | 8,692,006 | 5,383,062 |
KKR now relies heavily on these fees to produce consistent revenue. This is one differentiating factor of KKR compared to their peers and over the past few years they’ve built a strong pipeline of fee collections which gives investors better insight into cash flows. However, they are also heavily reliant on carried interest which, if you observe their “other liabilities” section of the balance sheet, you’ll see how large this number is. In volatile times, this large exposure to carried interest will make earnings and cash flow much less predictable.
Historical Analysis
The table below highlights a few financial metrics that highlight the growth KKR has experienced over the past several years. Most notably, they’ve grown their total assets sixfold since 2019.
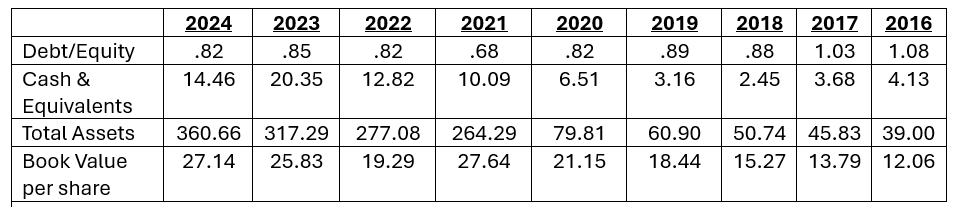
Comparing KKR’s financials to their competitors, we see below that they have outpaced pretty much all of their competitors with the exception of Blackstone.
Total assets growth over 8 years:
- KKR: 824%
- BN: 218%
- CG: 126%
- BX: 61%
- BLK: -40%
Free Cash Flow per Share (FY24 / 8-year growth):
- BN: -2.68 / -443%
- CG: -0.58 / 60%
- BX: 5.19 / 405%
- BLK: 28.36 / 142%
- KKR: 8.56 / 300%
The reason KKR has outpaced its peers is because 2024 was the first year in 8 years they’ve reported positive free cash flow. This is primarily due to the fees they’ve been able to generate from investment funds, infrastructure projects, and real estate holdings. They’ve been able to do this by utilizing large amounts of debt over the past several years to strategically acquire or invest in long-term assets and in 2024 their efforts became evident in their financial statements.
The amount of long-term debt they have is significant. At the end of 2023, they were holding more than $49,187 MM in long-term debt. Compare that to Blackrock who is the largest in this group in terms of AUM and only has $7,918 MM in long-term debt. Only BN has taken on more long-term debt but this is do to their business model which focuses on real infrastructure assets. Over the past several years KKR has set itself up nicely to strategically invest in a diverse set of assets which are expected to generate long-term, consistent revenue
Efficiency
Given we’re talking about alternative asset companies whose core responsibility is to invest in assets, we could look at a few different efficiency metrics. The table below has four metrics: sales per employee, net profit margin, ROIC, and long-term debt to equity.
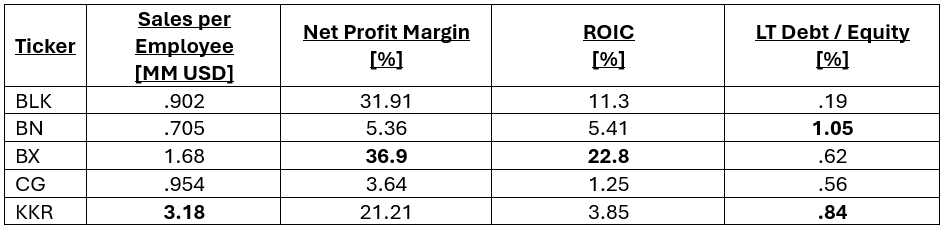
These were chosen as I wish to measure how efficiently they operate, how well they manage investments, and how much debt compared to equity they are trying to put to work. Some key things that stand out include:
- KKR is extremely efficient is its employee impact with a gross revenue per employee at $3.18MM. No one else is even close. Secondly, they are carrying a very large amount of long-term debt with respect to equity, demonstrating their dedication to long-term investments.
- BN also has a large LT debt to equity ratio, but they are more focused on real infrastructure which tends to be more capital-intensive, so their ratio is misleading to a degree. It does not necessarily signal aggressive long-term growth.
- BLK and BX are both strong capital allocators, however their revenue strategy is much less PE focused but more focused on generating stables feeds from ETFs/Alladin (BLK) and dominance in real estate (BX).
Current Valuation and Conclusion
The table below illustrates current valuation of each of these companies.
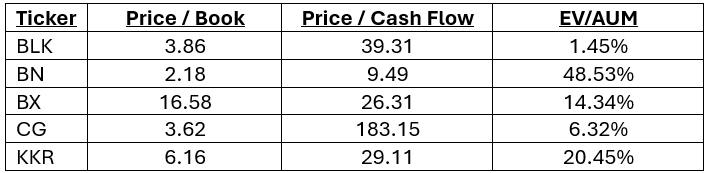
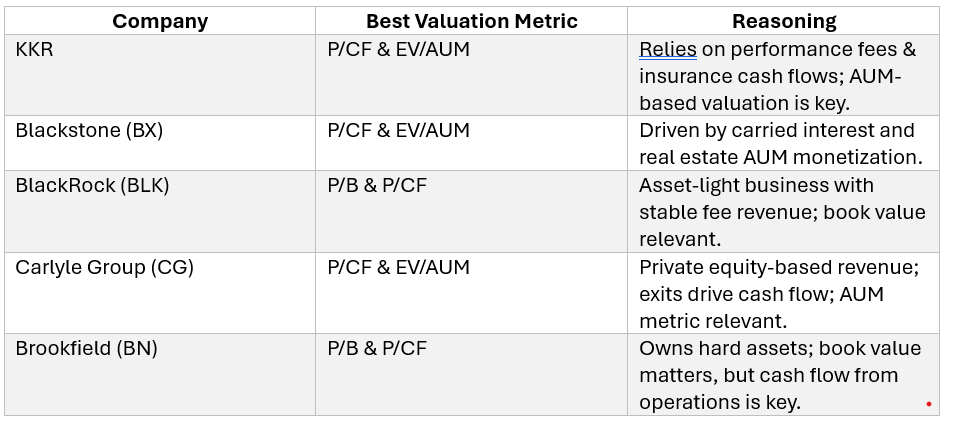
However, these aren’t exactly apples-to-apples comparisons as all these companies generate revenue in different fashions. Here’s a quick summary on these valuation metrics for each company and which one may be more appropriate:
Given KKR is most similar to CG and BX, let’s look at P/CF and EV/AUM for these three firms. KKR is clearly trading at a premium to these two on an EV/AUM basis. The market has fallen in love with this stock and it looks to be relatively expensive.
On a P/CF basis, it is on-par with BX but far cheaper than CG. Again, this is still not a perfect apples-to-apples basis given slightly differing business models but we can still deduce that at least on an EV/AUM basis, these firms are currently aggressively-priced.
Research indicates that 10-16% EV/AUM is more “normal” for high-fee PE firms. Given this, KKR continues to look like a decent buy, however, the downside remains probable given its exposure to carried interest and high valuation. Furthermore, the Trump administration is issuing new tariffs on China, Mexico, and Canada which presents uncertainty around inflation and interest rates. I would put KKR on a watchlist and if the broader market weakens while interest rates remain stable, I’d be interested in buying KKR with least 20% discount to have a sufficient margin of safety.
Update since earnings call on 2/4/25:
KKR dropped about 8.5% after their earnings was released on 2/4 to $149/share. Since then KKR bounced back about 3% to $154. This looks to be about as good a buying opportunity we will get. Furthermore, KKR pointed out some encouraging notes on their call that point to a continued long-term, Berkshire Hathaway-ish type of growth:
- Raising its stake in three existing holdings under its Strategic Holdings group which should support the group’s earnings.
- Annual profit was lower YOY, though earnings did beat analyst expectations.
- CEO Scott Nuttall described 2024 as a “good year, not a great year” as they are still figuring things out internally, even though the stock’s price is up nearly 90% over the past year. Nuttall describes 2025 as a year where things are expected to go relatively well or as he describes it in runner terms “the sun is out” and they’re “running on flat roads”. He also notes the dividend scaling opportunity is real and that the pipelines are opening up with more possible exits and opportunities globally across asset classes.

Leave a comment